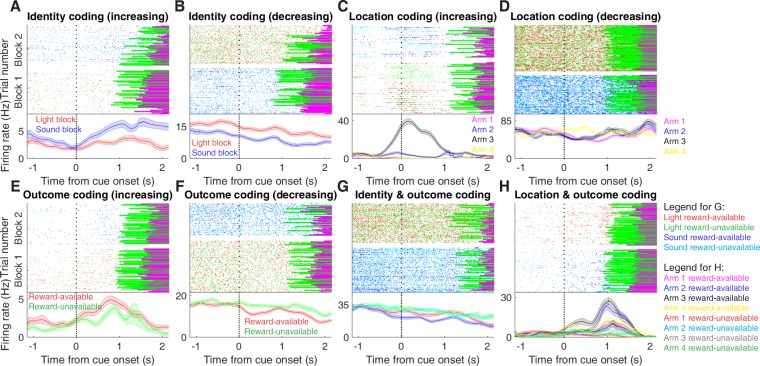
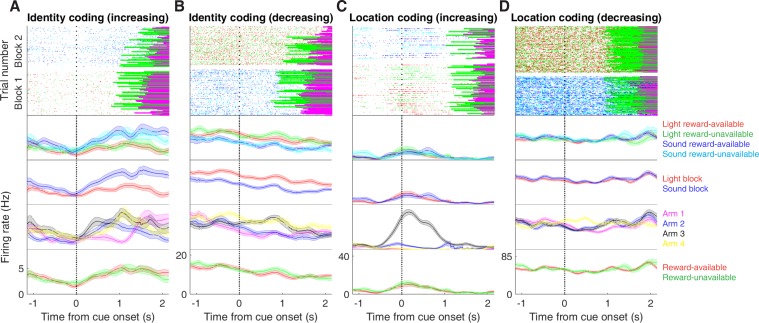
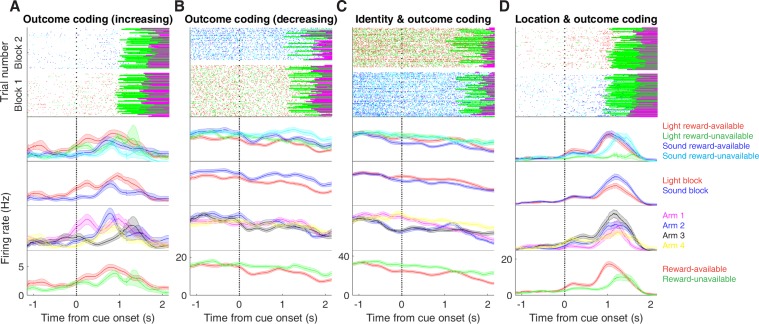
Figure 3. Examples of cue-modulated NAc units influenced by different task parameters.
(A) Example of a cue-modulated NAc unit that showed an increase in firing following the cue, and exhibited identity coding. Top: raster plot showing the spiking activity across all trials aligned to cue-onset. Spikes across trials are colour-coded according to cue type (red: reward-available light; green: reward-unavailable light; navy blue: reward-available sound; light blue: reward-unavailable sound). Green and magenta bars indicate trial termination when a rat initiated the next trial or made a nosepoke, respectively. White space halfway up the raster plot indicates switching from one block to the next. Dashed line indicates cue-onset. Bottom: PETHs showing the average smoothed firing rate for the unit for trials during light (red) and sound (blue) blocks, aligned to cue-onset. Lightly shaded area indicates standard error of the mean. Note this unit showed a larger increase in firing to sound cues. (B) An example of a unit that was responsive to cue identity as in A, but for a unit that showed a decrease in firing to the cue. Note the sustained higher firing rate during the light block. (C-D) Cue-modulated units that exhibited location coding. Each colour in the PETHs represents average firing response for a different cue location. (C) The firing rate of this unit only changed on arm 3 of the task. (D) Firing rate decreased for this unit on all arms but arm 4. (E-F) Cue-modulated units that exhibited outcome coding, with the PETHs comparing reward-available (red) and reward-unavailable (green) trials. (E) This unit showed a slightly higher response during presentation of reward-available cues. (F) This unit showed a dip in firing when presented with reward-available cues. (G-H) Examples of cue-modulated units that encoded multiple cue features. (G) This unit showed both identity and outcome coding. (H) An example of a unit that coded for both identity and location.


