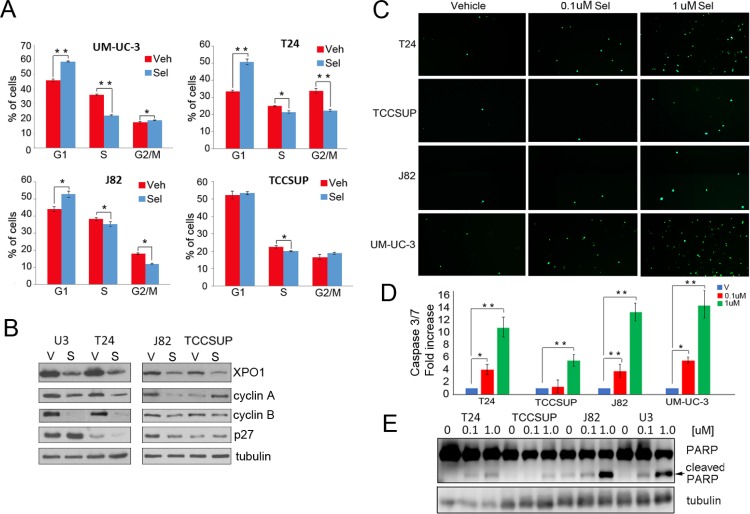
Figure 3. Selinexor induces cell cycle arrest and apoptosis.
(A) Cell cycle analysis of selinexor treated cells was assessed by flow cytometry. Cells were treated with vehicle (red) or 0.1 uM selinexor (blue) for 72 hours. (B) Expression of XPO1, cyclin A, cyclin B, and p27 in cells treated with vehicle (V) or 0.1uM selinexor (S) was assessed by Western immunoblot studies. Tubulin served as a loading control. (C) Cells were treated with two different doses of selinexor for 72 hours and followed by caspase3/7 immunofluorescence assays. (D) The extent of apoptosis detected by the caspase 3/7 assay was quantified by counting 4 separate fields and shown as fold increase over control. (E) Detection of PARP cleavage in cells treated with vehicle or increasing doses of selinexor for 72 hours by Western blot analysis. Arrow points to cleaved PARP. Tubulin served as a loading control. *denotes p ≤ 0.05, **denotes p ≤ 0.01. Error bars denote standard deviation; Student’s t test.

