
Figure 2.
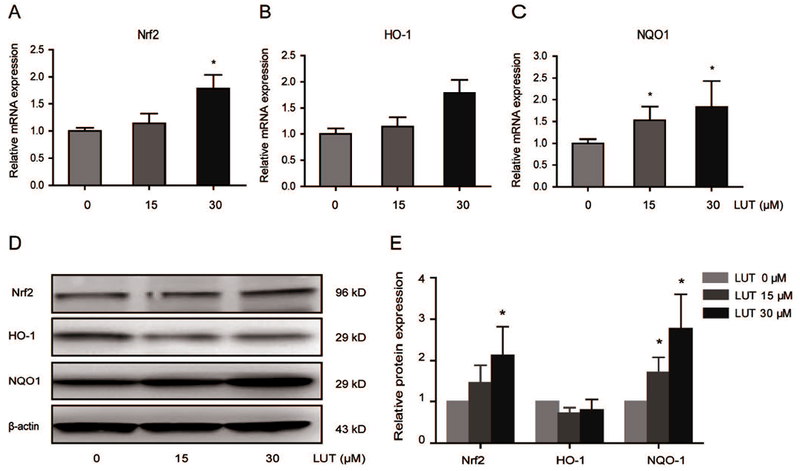
LUT activated Nrf2 and its downstream genes. (A-C) mRNA expression of Nrf2, HO-1, and NQO1 in HCT116 cells treated with LUT. HCT116 cells were treated with various concentrations of LUT for 3 days, and total RNA was extracted and converted to cDNA. Relative gene expression was assessed by qPCR. (D-E) Protein expression of Nrf2, HO-1, and NQO-1 in HCT116 cells treated with LUT. HCT116 cells were treated with various concentrations of LUT for 3 days, and then protein levels were measured by western blotting. Representative images of blots are shown in D. The relative densities of the blots were measured by ImageJ software. The data are presented as the mean ± SD from three independent experiments, as shown in E. * P < 0.05 and ** P < 0.01 versus the control group.