
Figure 5.
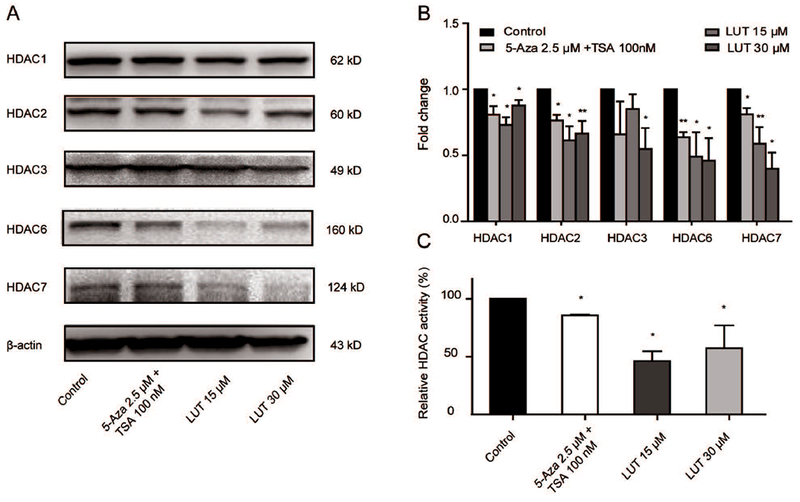
LUT decreased protein expression and enzyme activities of HDACs in HCT116 cells. (A-B) Protein expression of HDAC1/2/3/6/7 in HCT116 cells treated with LUT. HCT116 cells were treated with various concentrations of LUT or 5-Aza and TSA for 3 days, and protein levels were measured by western blotting. Representative images of blots are shown in A. The relative densities of the blots were measured by the ImageJ software. The data are presented as the mean ± SD from three independent experiments, as shown in B. (C) Relative HDAC activities in HCT116 cells treated with various concentrations of LUT or 5-Aza and TSA for 3 days. The data are presented as the mean ± SD. * P < 0.05 and ** P < 0.01 versus the control group.