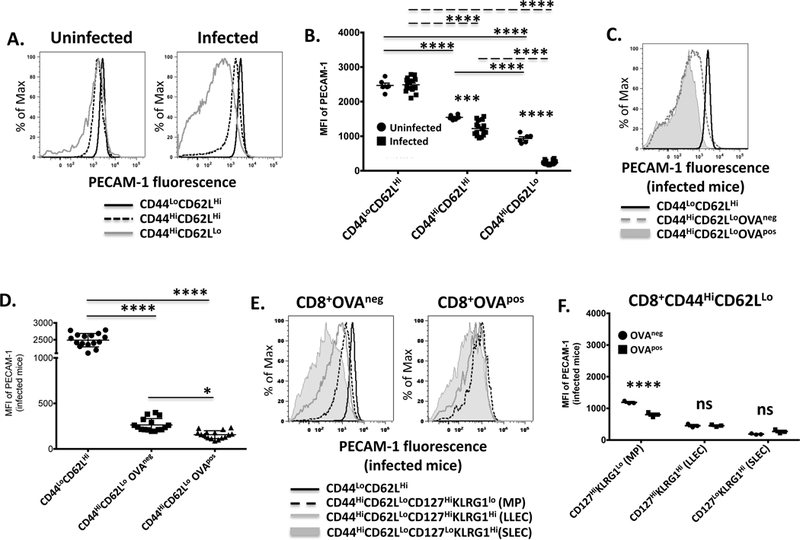
Figure 1. Central memory and memory precursor CD8+ T cells express PECAM-1 at levels that are intermediate between naïve and activated effector CD8+ T cells one week after bacterial infection in mice.

PECAM-1 expression on splenic CD8+ T cells was assessed one week after infection of C57BL/6 mice with Listeria monocytogenes expressing ovalbumin. (A) Fluorescence intensity of PECAM-1 expression on naïve (CD44LoCD62LHi), central memory (CD44HiCD62LHi), and activated effector (CD44HiCD62LLo) CD8+ T cells from an uninfected and infected mouse in one representative experiment. (B) Statistical analysis of mean fluorescence intensity (MFI) of PECAM-1 expression on naïve, memory and activated effector CD8+ T cells from uninfected (n=6) and infected (n=16) mice in 4 independent experiments. Symbols represent individual data points and lines represent means ± SEM. Differences between means were determined by 2-way ANOVA and Bonferroni’s multiple comparison test; ****p < 0.0001, ***p < 0.001. (C) Fluorescence intensity of PECAM-1 expression on naïve and activated effector CD8+ T cells with TCRs specific for the H-2Kb-specific, ovalbumin-derived SIINFEKL peptide (OVApos) or for non-ovalbumin bacterial antigens (OVAneg) from an infected mouse in one representative experiment. (D) Statistical analysis of MFI of PECAM-1 expression on naïve and OVAneg or OVApos activated effector CD8+ T cells from infected mice in 4 independent experiments. Symbols represent individual data points and lines represent means ± SEM. Differences between means were determined by 1-way ANOVA and Tukey’s multiple comparison test; *p < 0.05, ****p < 0.0001. (E) Fluorescence intensity of PECAM-1 expression on OVAneg or OVApos memory precursors (MP; CD127HiKLRG1Lo), long-lived effector cells (LLEC; CD127HiKLRG1Hi), or short-lived effector cells (SLEC; CD127LoKLRG1Hi) among activated effector (CD44HiCD62LLo) CD8+ T cells from an infected mouse in one representative experiment. PECAM-1 expression on OVAneg naïve (CD44LoCD62LHi) CD8+ T cells is shown as a reference. (F) Statistical analysis of MFI of PECAM-1 expression on OVAneg or OVApos MP, LLEC, or SLEC among activated effector CD8+ T cells from infected mice in 3–4 independent experiments. Symbols represent individual data points and lines represent means ± SEM. Differences between means were determined by 2-way ANOVA and Sidak’s multiple comparison test; ****p < 0.0001, ns = not significant.
