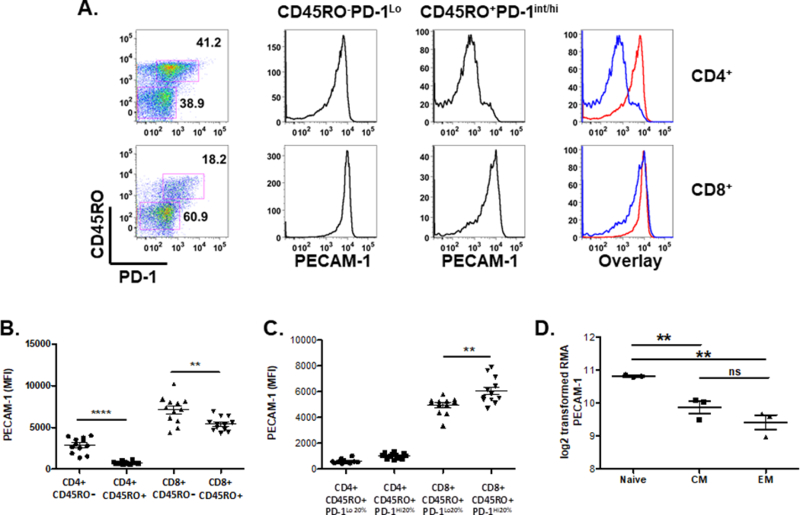
Figure 6. PECAM-1 is expressed at high levels in activated CD8+ but not CD4+ human T cells.

Buffy coat cells from healthy blood donors were evaluated for expression of PECAM-1 in naïve (CD45RO-PD-1Lo/Int) and activated (CD45RO+PD-1Int/Hi) CD4+ and CD8+ T cells. (A) Left panel identifies gating strategy for CD45RO-PD-1Lo/Int and CD45RO+PD-1Int/Hi subgroups in CD4+ (top panel) and CD8+ (lower panel) T cells. Middle panels demonstrate representative histograms of PECAM-1 expression from indicated gates, with an overlay of CD45RO-PD-1Lo/Int (red) and CD45RO+PD-1Int/Hi (blue) depicted in far right panel. (B) Average mean fluorescence intensity (MFI) of PECAM-1 expression was pooled from 12 donor samples from gates depicted in (A). (C) CD45RO+ CD4+ or CD45RO+CD8+ T cells from (A) were distributed into quintiles based on PD-1 expression, and MFI of PECAM-1 was calculated from cells within the lowest quintile (PD-1Lo20%) or highest quintile (PD-1Hi20%) of PD-1 expression. (B and C) **p < 0.01, ****p < 0.0001. (D) PECAM-1 mRNA expression was probed from a microarray dataset (GEO series GSE23321) of sorted human naïve, central memory (CM), and effector memory (EM) T cells from three healthy donors (29). **p<0.01, ns – not significant. ***P < 0.004, ****P < 0.0001.
