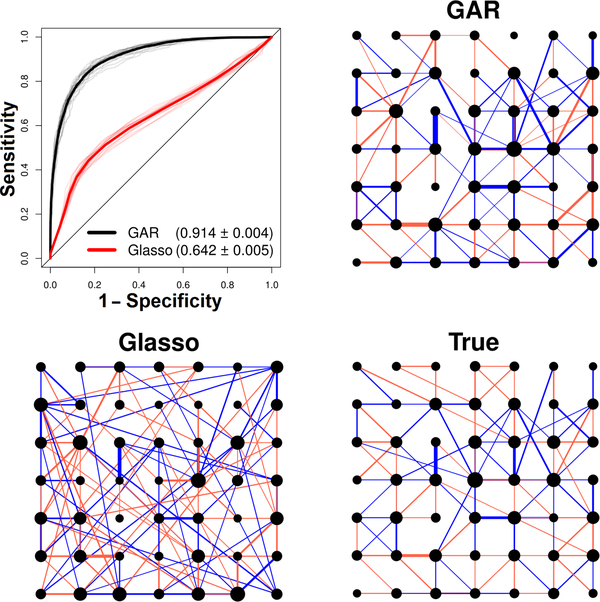
Fig. 1.
Glasso and GAR graph estimation performances for a simulated network. The true graph contains d = 49 neurons and 118 edges, and is based on parameter settings derived from cortical data. Blue and red edges denote positive and negative partial correlations and the size of each node is proportional to the number of its connections. The GAR and Glasso estimates displayed are based on a sample size of n = 200 (see simulation Section 2.4 for details). For clarity, we show only the 118 strongest estimated connections (Glasso estimated 642 edges and GAR 204). ROC curves were obtained for 50 repeat simulated data; all 50 curves are plotted as thin lines and their averages as thick lines. The average area under the curves (AUC) is written in parentheses ± 2 simulation standard error: GAR is more accurate than Glasso.

