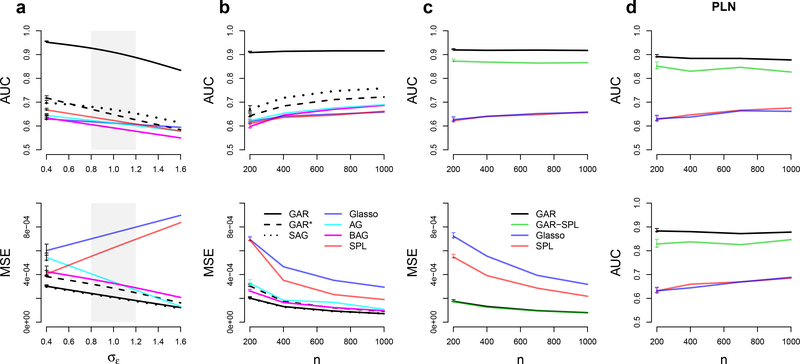
Fig. 3.
Performance of graph estimates, measured by areas under ROC curves (AUC), and of partial correlation estimates, measured by MSEs, for d = 50 neurons simulated according to Eq. (31) as functions of σϵ in (a), where σϵ ≈ 1 (shaded grey area) represents a real data scenario, and as functions of the sample size n in (b). (c) AUC and MSE for d = 50 observed neurons conditionally on q = 20 latent ones as functions of n. (d) AUC when methods are applied to non-Gaussian Poisson-lognormal (PLN) data without (top) and with (bottom) latent neurons, as functions of n. The horizontal intevals on the left of ah curves are 95% simulation intervals.

