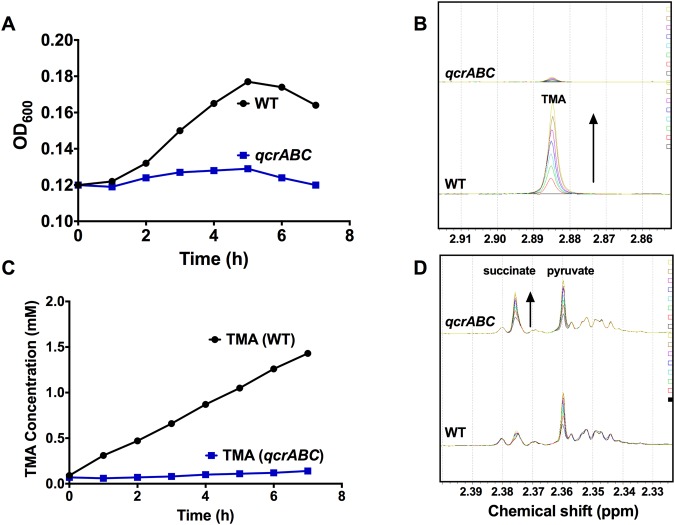
Figure 4.
Growth of wild-type and qcrABC strains on TMAO under oxygen-limited conditions and measurement of TMA accumulation. (A) growth of wild-type (black line and closed symbols) and qcrABC mutant (blue line and closed symbols) in the presence of 20 mM TMAO. Representative growth curve of several performed which all gave similar results. (B) 1H-NMR measurement of TMA accumulation during the growth curve shown in panel A. The region of chemical shift between 2.85 and 2.92 ppm is shown, with the TMA resonance at 2.885 ppm used for quantification. The different coloured spectra are media supernatants from samples taken every hour from time 0 (black spectra) to 7 h (yellow spectra), showing progressive TMA accumulation in the wild-type cells (black arrow) but no significant accumulation in the qcrABC mutant. The actual TMA concentrations are plotted in panel (C). Panel (D) shows the region of chemical shift between 2.32 and 2.40 ppm from the same spectra as in panel B, to illustrate the excretion of succinate (black arrow) in the qcrABC mutant.

