Figure 3.
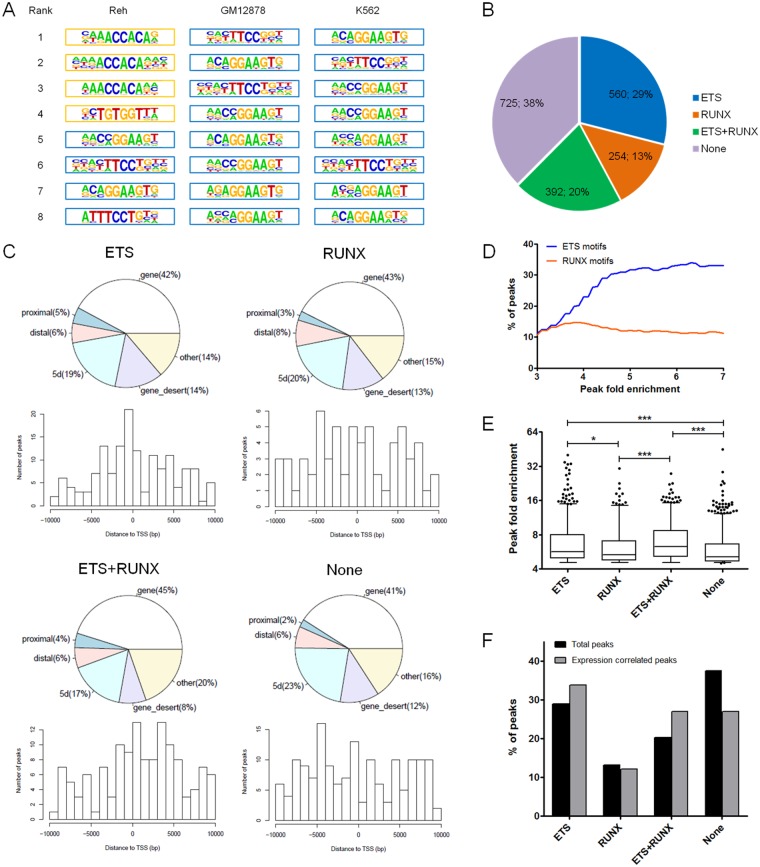
Consensus binding motifs enrichment analyses. (A) Consensus binding motifs associated with ETV6-bound regions are shown for Reh, GM12878 and K562 cell lines. ETS motifs (blue border) were significantly enriched in all three cell lines. RUNX motifs (orange border) were also significantly enriched in Reh cells. (B) Reh-derived ETV6-bound regions were classified based on the presence or absence of ETS or RUNX motifs (identified in (A) (C) Genomic annotations of peaks for each motif groups. Proximal: ≤2 kb upstream of TSS; Distal: 2 kb to 10 kb upstream of TSS; 5d: 10 kb to 100 kb upstream of TSS. Notably, ETS-unique peaks shows a tighter distribution across the TSS region. (D) Percentages of ETV6-bound regions containing either ETS or RUNX using variable peak fold enrichment thresholds. ETS but not RUNX motifs become increasingly more frequent with stronger peak fold enrichments. (E) Fold enrichment of all ETV6 peaks in Reh cells according to each motif groups. ETS containing peaks (ETS and the ETS/RUNX compound) have significantly greater fold enrichments. Whiskers represent the 5–95 percentiles. Statistical significance is calculated by two-tailed Student’s t test. (F) Proportion of each motif groups in expression-correlated ETV6 peaks (n = 74) compared to all ETV6 peaks (n = 1,931). ETS containing peaks (ETS and the ETS/RUNX compound) are even more over-represented in expression-correlated peaks.

