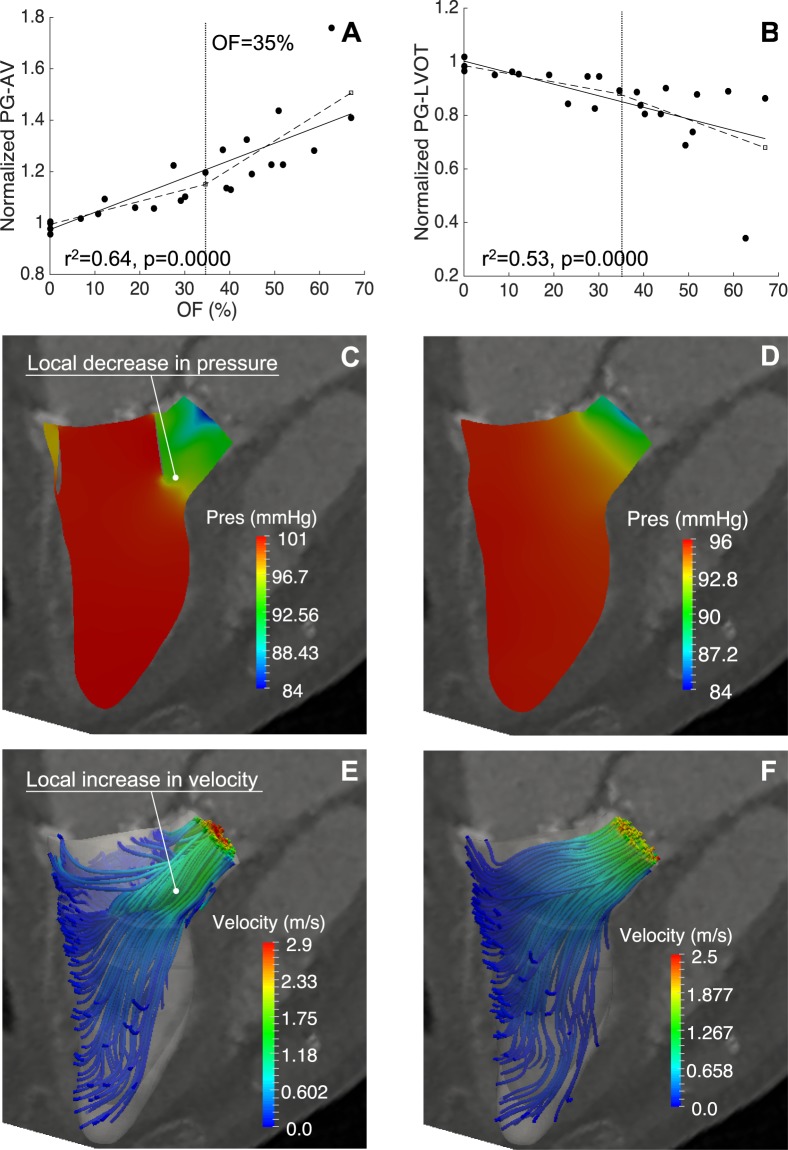
Figure 3.
Pressure gradients and flow topology. Apex-to-AV pressure gradients increased from the baseline values after implantation, with a significant change in the growth rate for OF >35% (A). The pressure gradients in the LVOT (B) decreased with increasing OF, due to a pressure recovery distal to the bottleneck, as typified by the pressure isocontours in Case 1 (C,D). The blood flow streamlines colored by velocity magnitude illustrate the corresponding variation in flow speed after and before implantation (E,F).

