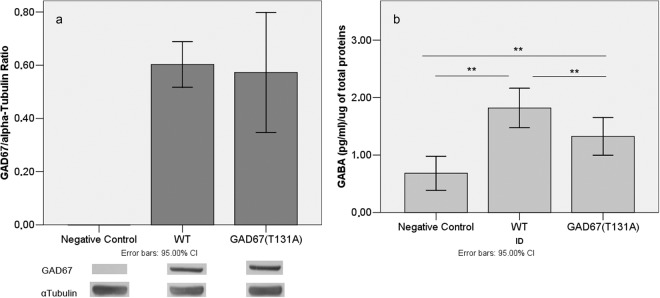
Figure 4.
Average amount of GAD67 protein and GABA production. (a) Densitometric analysis of Western Blot. Histograms report average amount of GAD67 normalized to alpha-Tubulin protein. Each histogram bar represents the mean value of triplicates. Cropped images of WB bands are reported below the graph, the original image of WB stain is given in Supplementary Fig. 5. (b) Histograms depict average amount of GABA normalized to total proteins amount measured. Each histogram bar represents the mean value of triplicates. Significance estimated by one-way ANOVA with LSD post hoc test (**P < 0.01).

