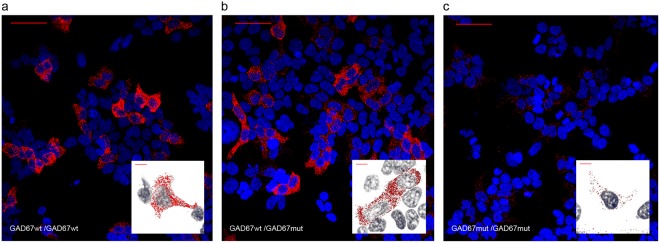
Figure 5.
Proximity Ligation Assay of GAD67 homodimerization in GAD67wt/wt, GAD67wt/mut, GAD67mut/mut HEK293T transfected cells. (a) Red dots represent dimerization events between GAD67wt monomers; (b) red dots represent dimerization events between GAD67wt and GAD67mut monomers; (c) red dots represent dimerization events between GAD67mut monomers. Scale bar = 40 μm: In the white boxes magnification of representative cells are reported. Scale bar = 10 μm.

