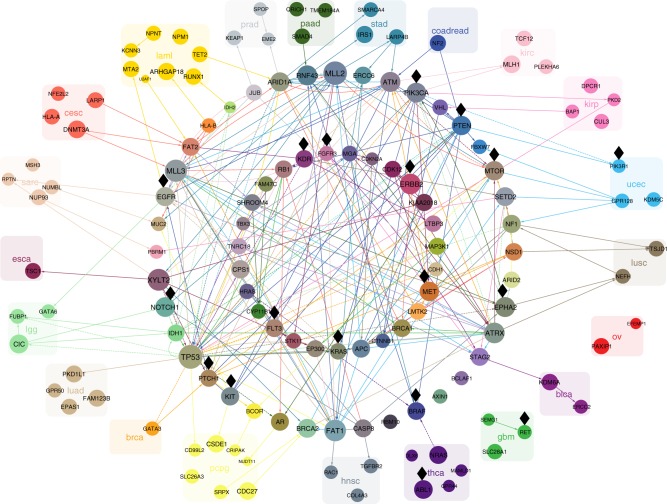
Fig. 2.
The cancer-specific connections between the genes. For clarity we limit the display to only include connections between the 20 most frequent and connected mutations per cancer type. The Bayesian networks for each cancer type are overlaid on the same union of gene nodes. Edges highlight interactions between the selected mutations and are coloured by the cancer type for which they occur (leukaemia: yellow; glioblastoma: green, etc.). Directed edges point in the inferred direction of dependency, whereas undirected edges indicate cases where the direction cannot be inferred. Solid edges indicate positive correlation (a degree of co-occurrence) while dashed edges indicate negative correlation (a degree of exclusivity) between the genes connected. Genes are coloured according to the colours of their edges. Those with edges in only one specific cancer type are grouped and labelled with the same colour. Genes with edges in different cancer types are arranged in the two circles in the centre. The size of each gene correlates with the total number of edges across all cancer types, including edges that are not shown. Black diamonds mark putatively actionable targets

