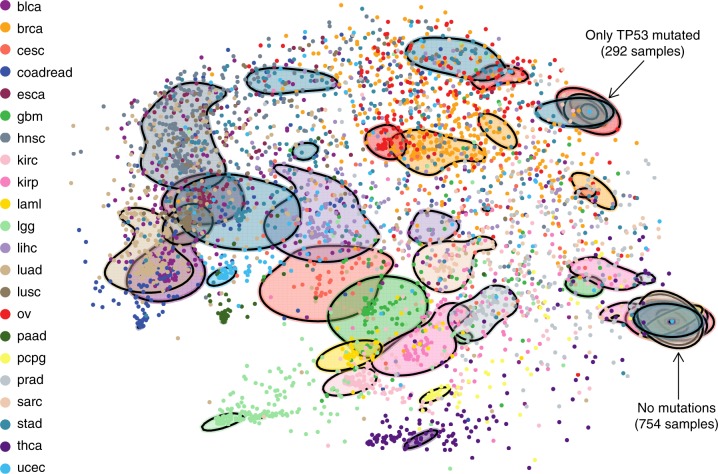
Fig. 3.
Visualisation of pancancer heterogeneity. 2D visualisation of the similarity between patient samples based on their fit to each cancer-specific Bayesian network, highlighting the heterogeneity within and across cancer types. For example, stomach, breast and liver cancer show high inter-tumour heterogeneity with a high spread across the plot, whereas pancreatic cancer shows low inter-tumour heterogeneity and is much more localised. Ovarian and breast cancers as well as bladder cancer and lung adenocarcinomas show similar mutational profiles, while lower grade glioma is rather distinct from other cancer types, as is thyroid cancer. The solid shapes are based on contours that together contain a total of 50% of the respective cancer types. The group of samples on the lower right possess no mutations among the 201 genes while those exhibiting a mutation only in TP53 are also indicated. Versions highlighting certain cancer types are displayed in Supplementary Fig. 5

