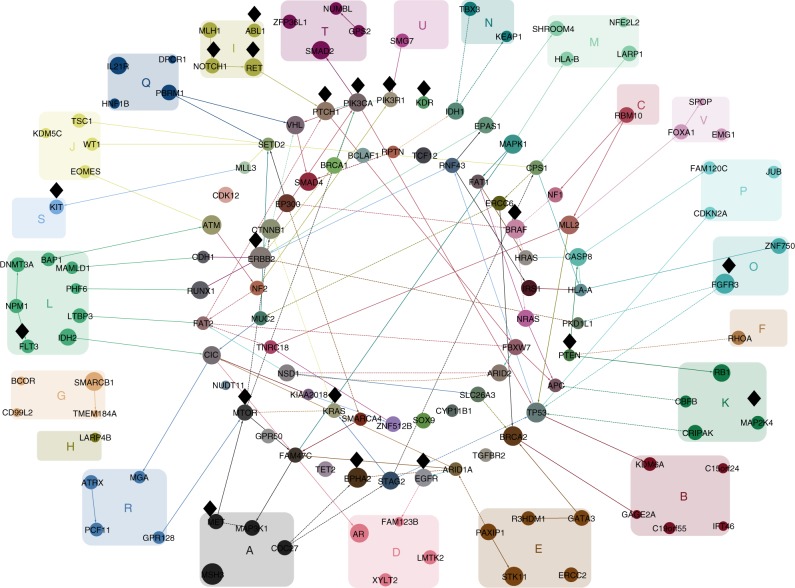
Fig. 5.
The cluster-specific connections between the genes. The connections between the 20 most frequent and connected genes per cluster (rather than per cancer type, as in Fig. 2). Black diamonds near nodes indicate putatively actionable genes. Edges highlight interdependencies between the selected mutations: solid for positive and dashed for negative correlation. Directed edges point in the inferred direction of dependency, whereas undirected edges are where the direction cannot be inferred. Node size reflects the total number of edges, including edges not shown. Nodes are coloured by combining the colours of their edges from the different clusters

