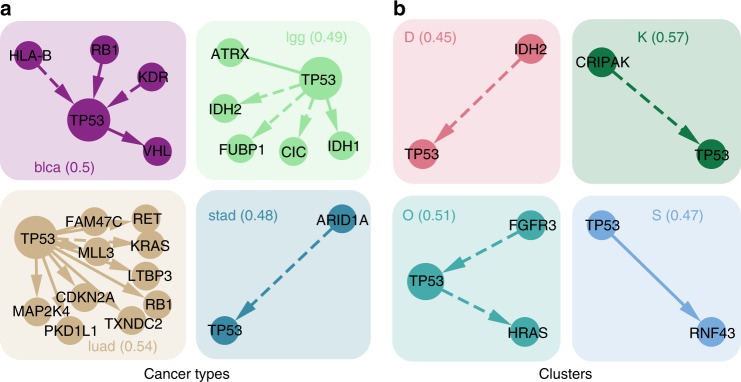
Fig. 6.
Focus on TP53. a Cancer types or b clusters are characterised by interactions of TP53 with different genes. For cancer types or clusters where TP53 shows a similarly high mutation frequency (around 0.5), we display all its interactions (positive correlation is represented by solid arrows, negative correlation by dashed). Groups are annotated by the cancer type or cluster name and the respective mutation frequency of TP53 across samples (in brackets). Several of these interactions have been studied in cancer. For example, an inverse relationship between ARID1A and TP53 was previously observed in gastro-intestinal cancers52 while TP53 mutations co-occur with RB1 in bladder cancer53

