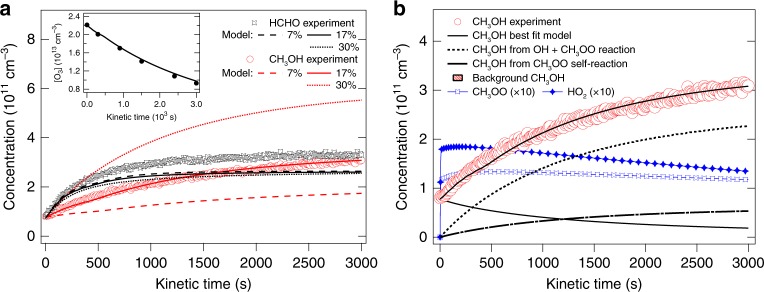
Fig. 3.
Measured and modelled methanol and formaldehyde time profiles. a Full lines with model from Supplementary Table 1 (adjusted to O3 decay rate, inset) with ϕCH3OH = 17%, dotted line ϕCH3OH = 30%, dashed line ϕCH3OH = 7%. b The solid black line shows the modelled CH3OH concentration with major contributions being production from self-reaction (dashed-dotted line) and reaction of CH3OO + OH (dashed line) and removal by the reaction of CH3OH with OH. HO2 and CH3O2 concentrations from the model are also shown

