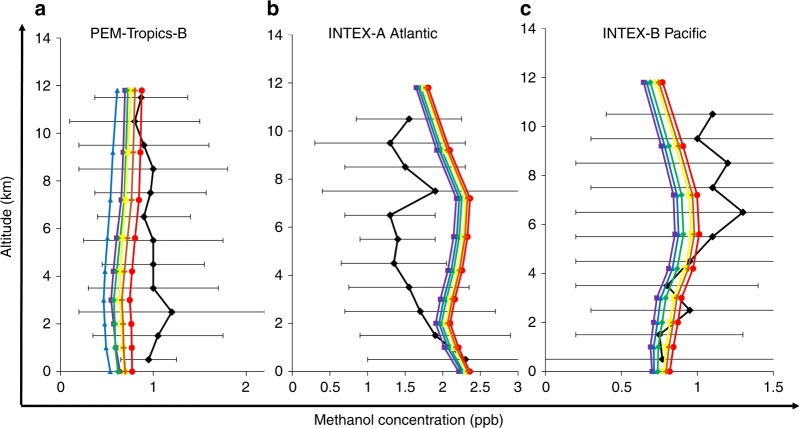
Fig. 6.
Comparison of methanol field measurements with modelled outcomes as a function of altitude. Vertical profiles of measured and modelled CH3OH over a tropical Pacific b midlatitude Atlantic and c Pacific. The data compilation of Müller et al.18 containing measured CH3OH are used for the model-measurement comparison. Violet square symbols represent mean CH3OH produced for the base case (without the OH + CH3OO reaction). Blue triangle, green diamond, yellow star, orange plus and red circle symbols represent mean CH3OH produced at the branching fractions of the channel of 0.07, 0.1, 0.15, 0.17 and 0.2, respectively. Black triangles represent the measurement CH3OH data and the black error bars represent measurement variability (standard deviation)

