Fig. 2.
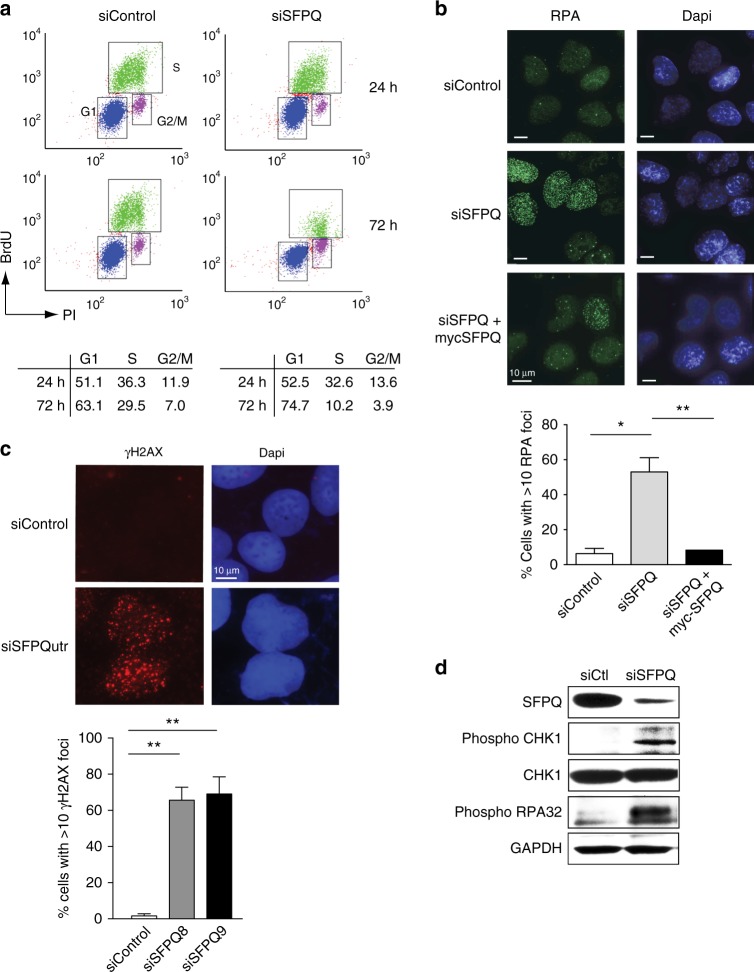
Defects in SFPQ cause replication stress. a FACS analysis showing that knockdown of SFPQ (siSFPQ9) leads to a reduction in the s-phase cells. Quantification of FACS data was averaged from three independent experiments. b Microscope images showing that knockdown of SFPQ with siSFPQ8 in U2OS cells leads to increased RPA foci. Expression of exogenous myc-SFPQ (indicated) resulted in partial suppression of RPA foci in SFPQ-depleted cells. Quantification is shown below and indicate mean percentage of cells with >10 RPA foci ± s.d. More than 100 cells were counted from each of three independent experiments. Statistical significance was determined using Student’s t-test (*<0.05 and **<0.01). c Images showing increased γH2AX foci in U2OS cells knocked down with siSFPQutr compared with control cells. Graph shows mean percentage of cells with >5 γH2AX foci ± s.d. Data are plotted from three independent experiments. Statistical significance was determined using Student’s t-test (**p < 0.01). d Western blot showing that knockdown of SFPQ with siSFPQ8 leads to the phosphorylation of CHK1 on serine 345 and phosphorylation of RPA32 on Ser4/Ser8

