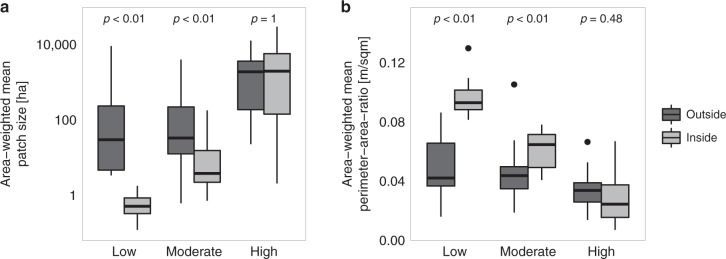
Fig. 3.
Comparison of disturbance patterns inside and outside protected areas. a Area-weighted mean patch size and b area-weighted mean perimeter-area-ratio are compared for areas inside and outside protected areas for three global clusters of disturbance activity (cf. Table 1). Boxplots denote the median (center line) and interquartile range (box), with whiskers extending to three times the interquartile range and points indicating values outside this range. Test statistics and p-values are based on approximate Kruskal–Wallis tests with 9999 permutations

