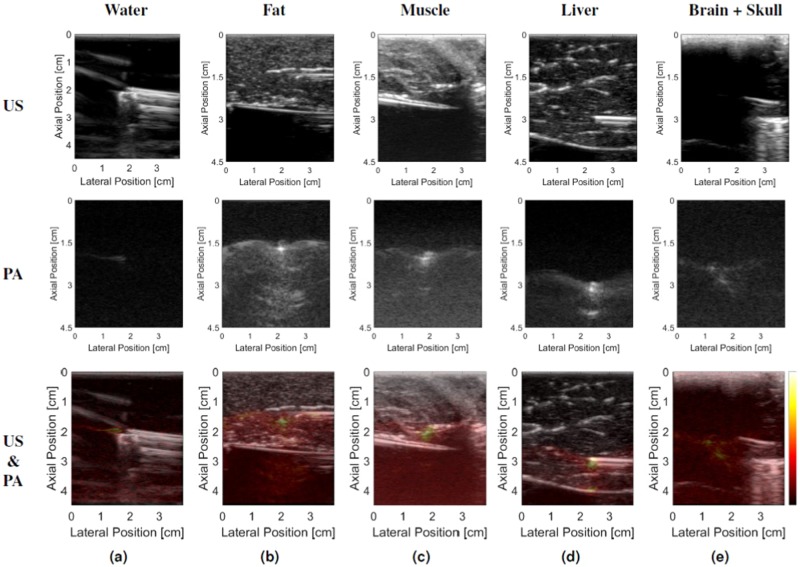
Figure 3.
Representative ultrasound (US) and photoacoustic (PA) image pairs when visualizing the needle tip in (a) water, (b) fat, (c) muscle, (d) liver, and (e) brain tissue. Note that the brain tissue and inserted needle are not visible in the ultrasound image in the presence of 1 mm-thick cranial bone, yet we can detect the needle tip in the corresponding photoacoustic image. All photoacoustic images are shown with 60 dB dynamic range, with the color bar indicating the relative mapping used to represent the photoacoustic signal amplitudes in the overlaid photoacoustic images. All needle insertions angles were 0° relative to the lateral dimension of the ultrasound probe.

