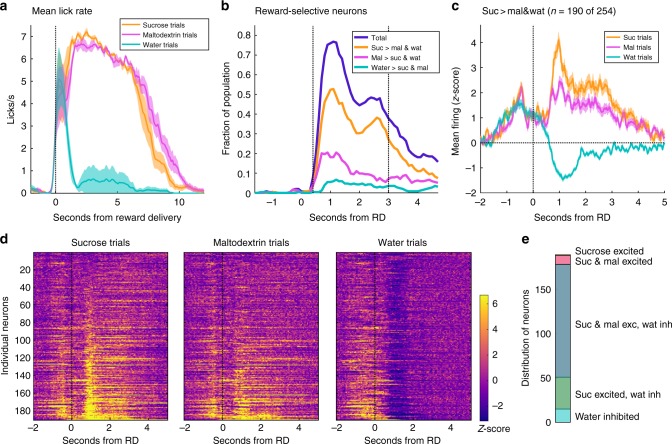
Fig. 6.
VP neurons report the relative value of three reward outcomes. a Lick rate on sucrose (orange), maltodextrin (pink), and water (blue) trials. Shading is SEM. b Histogram of the fraction of neurons in VP that meet criteria for reward selectivity relative to reward delivery time. Plotted are the total fraction of reward-selective neurons (dark blue) and, of those, neurons with greatest firing for sucrose (orange), maltodextrin (pink), or water (light blue). Dashed lines indicate the window (0.4–3 s) for which reward-selective neurons were selected for (c–e). c Mean normalized firing rate of neurons that are reward-selective for any bin 0.4–3 s post reward delivery and have greatest firing rate for sucrose. Shading is SEM. d Normalized firing rate of individual neurons included in c. Neurons in all three plots are sorted by amount of firing on sucrose trials in the bin with the most number of neurons with greatest firing for sucrose. e Distribution of neurons in (c) and (d) according to sucrose excitation, maltodextrin excitation, and water inhibition

