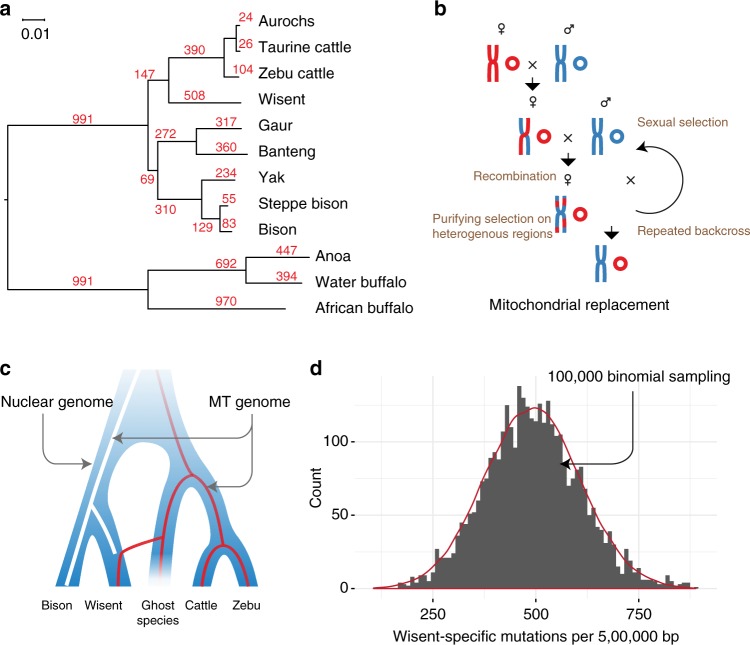
Fig. 3.
Mitochondrial genome replacement model. a Phylogeny of the mtDNA genomes of 12 species and per branch the number of mutations, estimated using RAxML. b Hypothetical crossing of two species indicated by red and blue, respectively, proposed to have led to the replacement of mtDNA (small circles). c The ghost species introgression model, leading to the transfer of mtDNA from the ghost species to wisent (red line). d Histogram of wisent-specific mutations. The red line above the histogram represents the distributions generated by 100,000 binomial sampling based on prior parameters (Methods) and is not expected to fit the observed distribution if the wisent genome contains sequences originating from the ghost species

