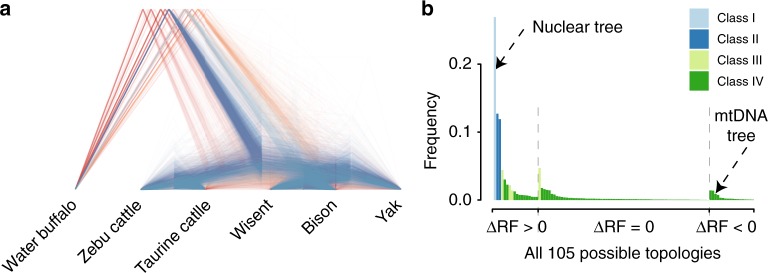
Fig. 4.
Incomplete lineage sorting model. a Gene trees with high bootstrap support. Blue lines indicate the most frequent nuclear phylogeny (Fig. 1b). b The empirical frequencies of all 105 possible gene tree topologies ordered according to (1) ΔRF (>0 for gene trees more similar to the nuclear genome tree; 0 for trees equally similar to the nuclear and mtDNA tree; and <0 for trees more similar to the mtDNA tree) and (2) frequency. The four classes of tree topologies are indicated by different colors

