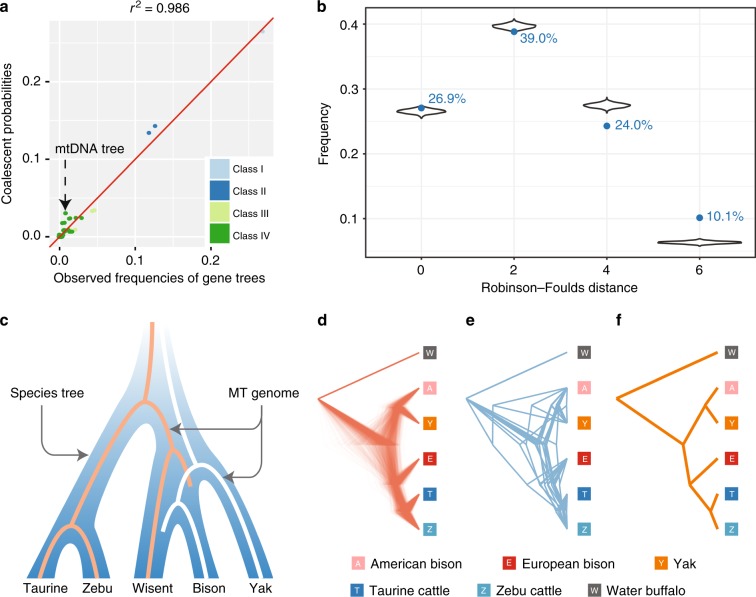
Fig. 5.
Validation of coalescent simulations. a Comparison of simulated frequencies based on coalescent probabilities of gene topologies of different classes with the corresponding observed frequencies. The mtDNA topology is indicated. b Comparison of the distributions of Robinson–Foulds distances between the species tree and the observed gene trees (blue numbers and solid blue points) and between the species tree and the gene trees expected on the basis of coalescent simulations (violin plot). The data of violin plot are from 1000 separated simulations (each simulation contains 15,836 gene trees). c ILS model showing fixation of different MT genomes in the branches leading to wisent and bison, respectively. d Simulated gene trees with the same topology as mtDNA. e Observed gene trees with the same topology as the mtDNA tree. f Observed mtDNA tree. By scaling all trees in (d, e, f) have the same total length

