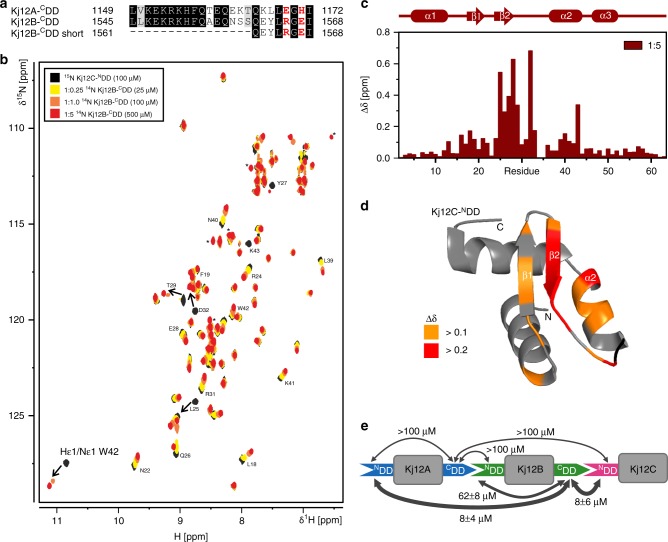
Fig. 3.
Docking domain interaction. a Sequence alignment of Kj12A-CDD and Kj12B-CDD used in this study. Identical residues are highlighted with dark gray boxes and residues with similar chemical properties are shown in light gray boxes. Key residues for DD interactions are shown in red. b Overlay of the 1H,15N-HSQC spectrum of 100 µM 15N-labeled Kj12C-NDD in the absence (black) and presence of increasing amounts of unlabeled Kj12B-CDD. The molar ratios of the two docking domains are 1:0.25 (yellow), 1:1 (orange), 1:2.5 (dark orange), and 1:5 (red). c Histogram of chemical shift changes vs. sequence for Kj12C-NDD upon addition of a five-fold molar excess of unlabelled Kj12B-CDD with the secondary structure depicted above. d Chemical shift changes for Kj12C-NDD upon addition of unlabeled Kj12B-CDD mapped onto the structure of Kj12C-NDD. e Kd values for all DD interactions in the Kj12ABC NRPS as measured by ITC

