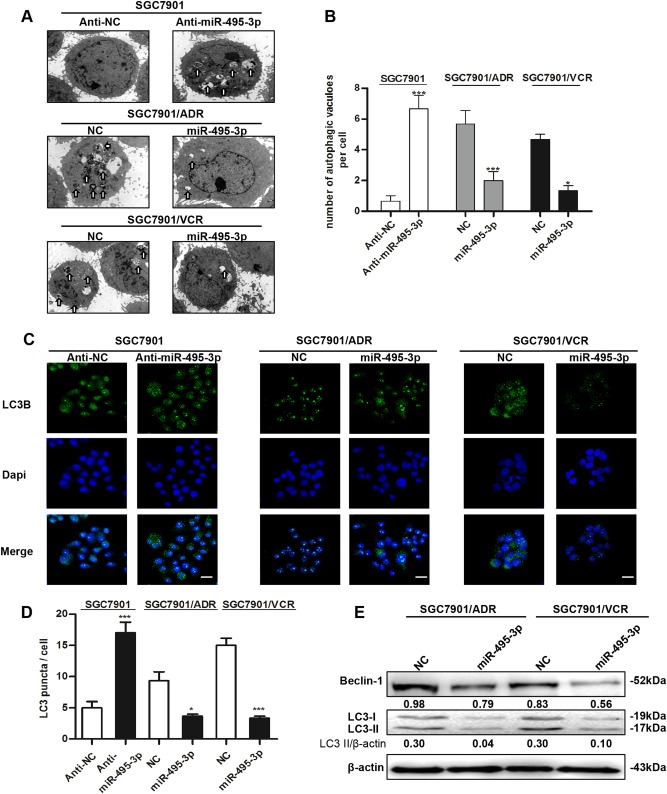
Fig. 2. miR-495-3p inhibits autophagy in GC MDR cells.
a Transmission electron micrographs of morphological changes in SGC7901 transfected with miR-495-3p inhibitor or GC MDR cells transfected with miR-495-3p mimic. White arrows represent autophagosomes or autolysosomes. (Scale bar = 500 nm). b Quantitative analysis of the number of autophagic vesicles. c Representative images and d Quantification of LC3 puncta (green) in SGC7901 transfected with miR-495-3p inhibitor or GC MDR cells transfected with miR-495-3p mimics. Scale bars: 50 μM. e Western blot analysis of the protein levels of Beclin-1, and LC3I/II in GC MDR cells transfected with miR-495-3p mimic or nc. All values were expressed as mean ± SD, n = 4 for each group. *P < 0.05, **P < 0.01, ***P < 0.001

