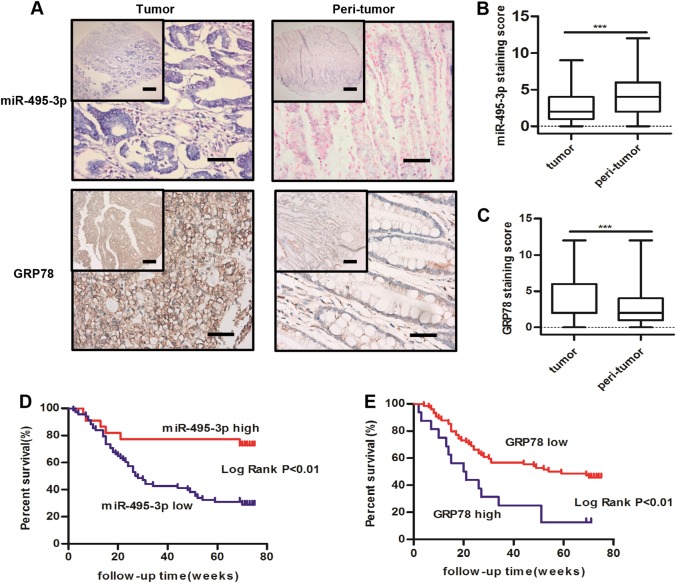
Fig. 7.
Expression levels of miR-495-3p and GRP78 in GC specimens. a The expression levels of miR-495-3p (upper) and GRP78 (lower) in peri-tumor and primary GC tissues, scale bars: 500 μm (top) and 200 μm (bottom). b miR-495-3p and c GRP78 expression staining score in peri-tumor and primary GC tissues. Kaplan–Meier survival curves of GC patients expressing miR-495-3p (d) and GRP78 (e) GC patients were ranked based on the staining score and divided into high-expression (>4) and low-expression (≤4) groups. *P < 0.05, **P < 0.01, ***P < 0.001

