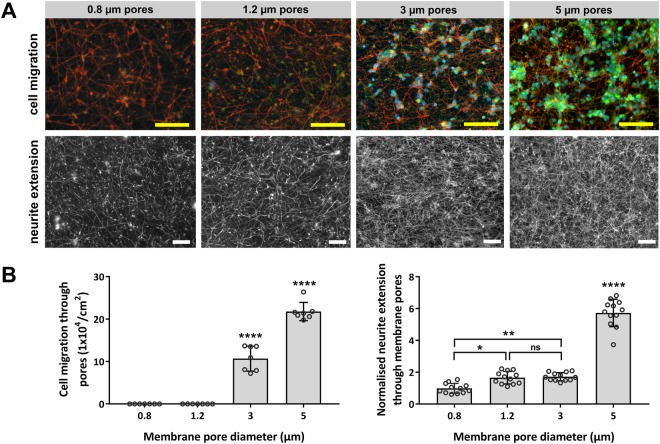
Figure 3.
The effect of pore size on SH-SY5Y migration and neurite extension through the membrane. (A) Images show the lower non-seeded side of the microporous membranes after 5 days in culture, following removal of cells and neurites from the upper side of the membranes. (B) Cell migration plot shows counts of in-focus DAPI stained cell nuclei on the lower side of the membrane. Neurite plot shows the mean neurites on the lower side of the membrane in comparison to the 0.8 µm pore diameter membranes and after normalisation against differences in membrane porosity. Plots show the means ± SD with dots representing fields of view (cell migration: n = 7, neurites: n = 12). p > 0.05 (*), p > 0.0001 (****), “not significant” (ns). Scale bar(50 µm).

