
Fig. 6.
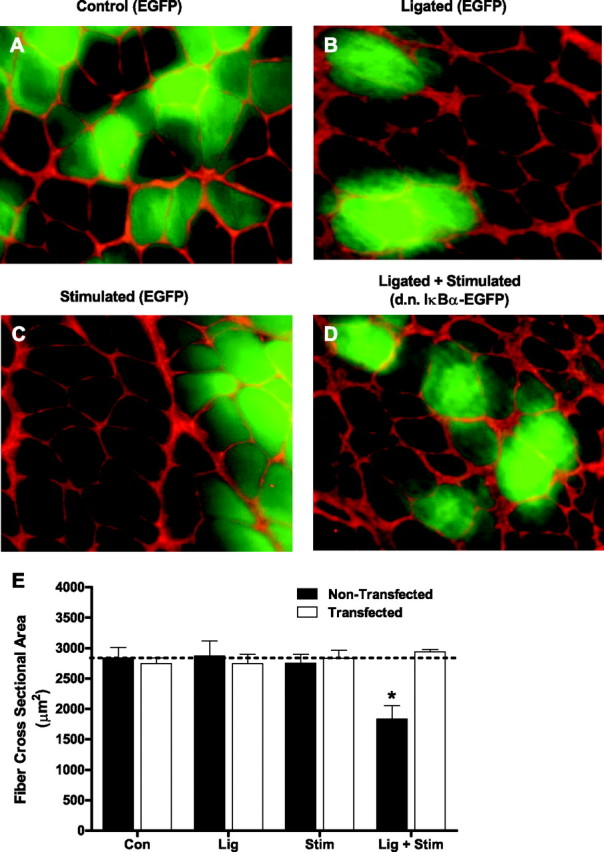
Representative cross sections of the soleus muscle from control (A), ligated (B), stimulated (C), and Lig + Stim (D) groups. Muscle fibers fluorescing green in control, ligated, and stimulated sections are expressing EGFP, whereas muscle fibers fluorescing green in Lig + Stim sections are expressing the d.n. IκBα-EGFP fusion protein. E: Muscle-fiber cross-sectional area of ∼250 fibers per muscle (including both transfected and nontransfected fibers) from six muscles per group. *P < 0.05 vs. all other groups.