
FIG. 1.
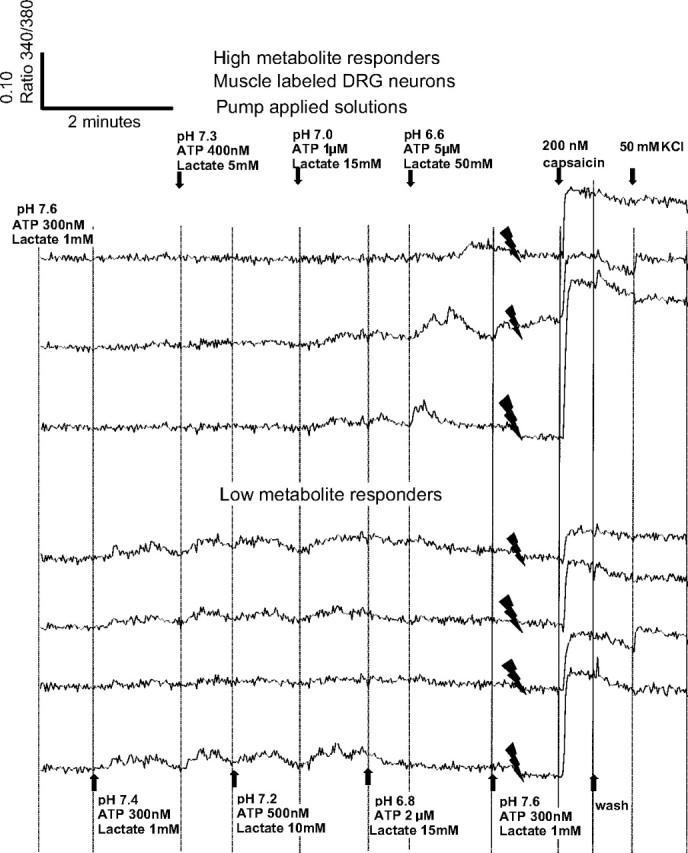
Responses of individual dorsal root ganglion (DRG) neurons to increases in pump-applied metabolites, with responses to 200 nM capsaicin and 50 mM KCl added at the end of each trace. Solid downward-pointing spike-like symbols indicate where a portion of the trace stopped, then started to allow the capsaicin and KCl responses to be included on this figure. In all, 17 DRG neurons were retrogradely labeled from skeletal muscle with DiI in this well, and all 7 of these that responded to metabolite increases are shown here. To allow for larger font size, the amounts of metabolites applied are split between top and bottom, even though the same metabolites are applied at the same time to the neurons depicted on both top and bottom. Arrows and vertical lines indicate when metabolite changes were made; wash = pH 7.4, 1 mM lactate, with 0 adenosine triphosphate (ATP). Vertical scale is the ratio of intensity of light emitted at 340 nm/380 nm. Maximum possible calcium responses caused by application of either capsaicin or KCl are at the right of each trace.