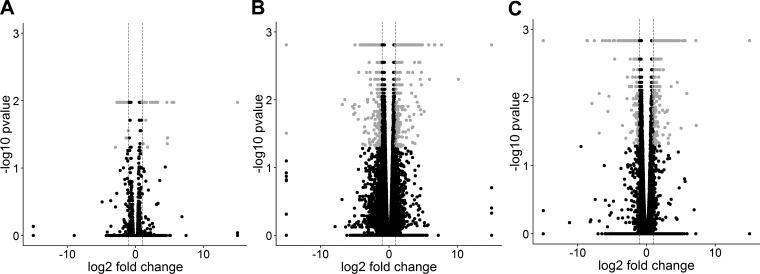
Fig. 4.
Volcano plots of the 3 pairwise comparisons based on the results of Cuffdiff. A: BAVc vs. TAVc, B: BAVc vs. TAVn, and C: TAVc vs. TAVn. The x-axis is the log2 fold change between groups. The −log10(P value) is plotted on the y-axis. Each point represents a gene. Only genes that passed quality controls were plotted. Vertical dashed lines at −log2 fold changes of −1 and 1 are plotted. Gray points indicate significant genes with q values (P corrected for multiple testing) < 0.05 and absolute fold change > 2.

