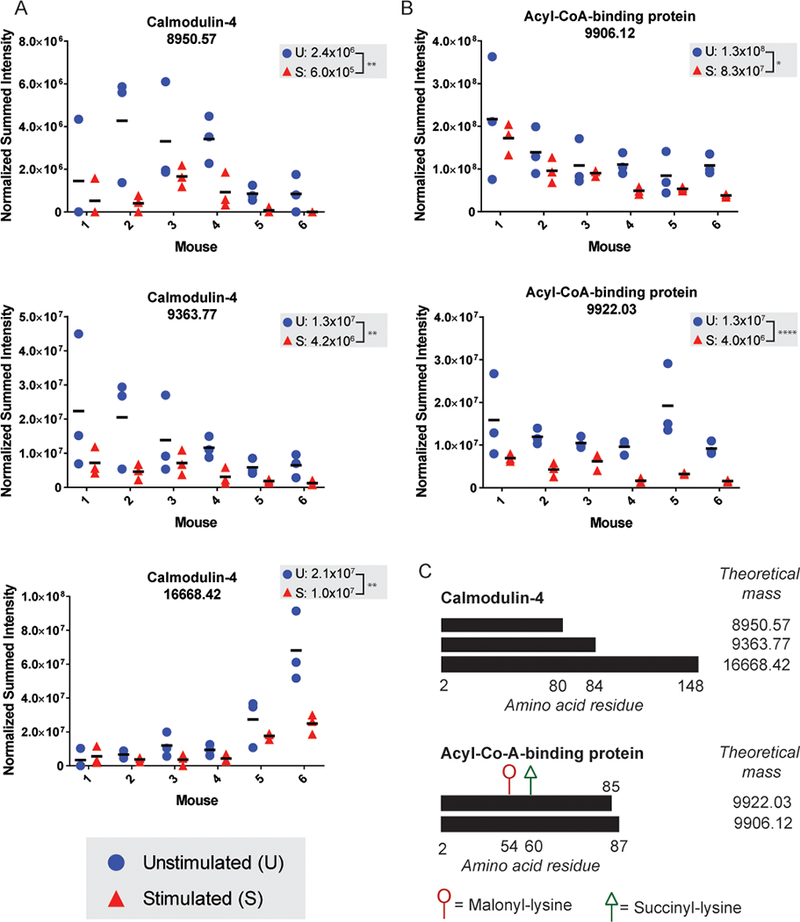
Figure 4. Examples of proteoforms that are less abundant in the mechanically stimulated samples.

Plots display the normalized summed peak intensities for (A) CALM4 and (B) DBI wherein the data points represent individual hind paw sections per mouse. The means for sample groups (mechanically stimulated and unstimulated) are shown on a per mouse basis (horizontal bars) and across mice (listed at the top of each plot). Statistical significance is indicated and statistical comparisons are based on a paired two-way ANOVA (*p < 0.05 **p < 0.01, *** p < 0.001, **** p < 0.0001, n.s. denotes a non-significant result). (C) Visual representation of the observed proteoform sequences for Calmodulin-4 and Acetyl-CoA-Binding Protein shown next to the theoretical masses (in Da). Supporting MS data for each proteoform are provided in Figure S3.
