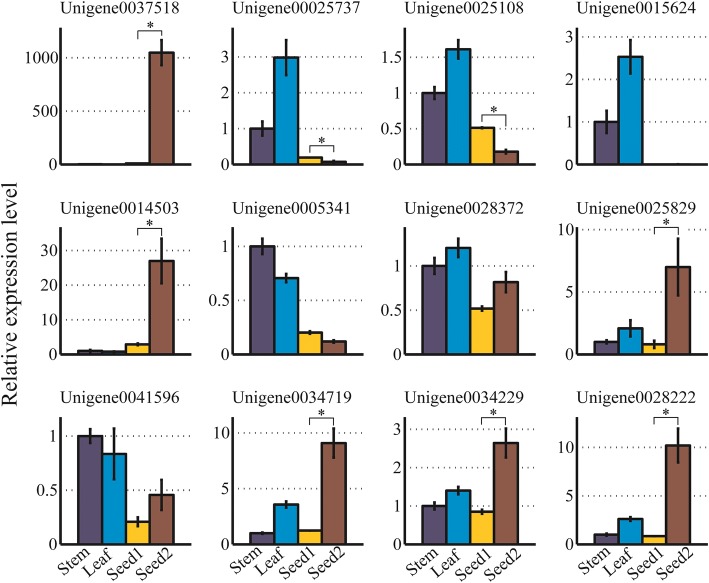
Fig. 6.
Quantitative real-time PCR analysis of twelve unigenes associated with the fatty acid elongation. Error bars were calculated based on three biological replicates. The expression level of stem sample was normalized to 1. The asterisk above the bars indicates the significant differences between Seed1 and Seed2 (p < 0.05)

