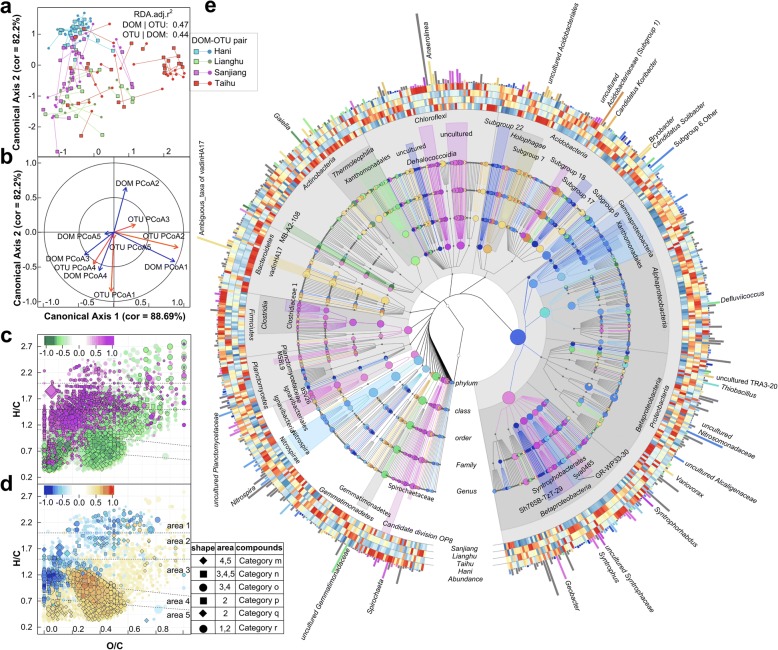
Fig. 4.
Associations between DOM composition and bacterial community. Canonical correlation analysis was conducted using first five principal coordinates (PCo1–5). a Combined score plots of the corresponding ordinations pairs of DOM composition and microbial community along the first and second canonical axes. The lengths of connecting lines represent the dissimilarities of DOM composition and microbial community. b Plot showing loading coefficients of the five pairs of principal coordinates imported on the corresponding first two pairs of canonical axes. c, d van Krevelen plots of DOM molecules showing positive and negative Spearman’s rank correlations with the DOM ordinations along the first (c) and second (d) canonical axes, indicating their association with microbial community dynamics. e Taxonomic cladogram showing positive and negative correlations with microbial ordinations along the first two canonical axes, indicating their association with DOM compositional changes. Rings of the cladogram provide a heatmap of the genera (> 0.01%) among the sampling regions with red and blue meaning more and less accumulated, respectively. Relative abundances of the taxa or genera are shown as the clade marker size or level 5 ring height. The color gradient bars in c and d, “purple to green” (for the first canonical axis) and “orange red to blue” (for the second canonical axis), indicate the values of coefficients. These color scales are also applied to the associations between taxa and microbial ordinations along the first and second canonical axes (e). Compounds category m: polycyclic aromatics; n: polyphenols and polycyclic aromatics with aliphatic chains; o: phenolic and highly unsaturated compounds; p: unsaturated aliphatics and aromatics with aliphatic chains; q: saturated fatty, sulfonic acids, and carbohydrates; r: N-containing compounds, i.e., peptides

