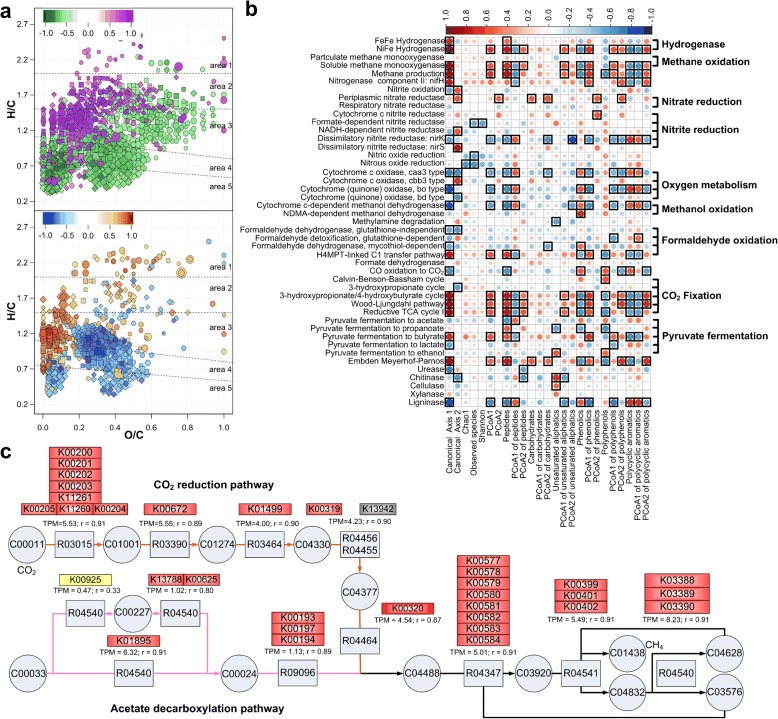
Fig. 5.
Associations between soil DOM composition and microbial functional capabilities estimated by metagenomics. a van Krevelen plot showing the positive and negative Spearman’s rank correlations of DOM molecules with the first canonical axis of canonical correlation analysis which indicates the correlation between DOM composition and FOAM orthologs. “Blue to red” gradient colors indicate the values of the coefficients. b Pearson’s correlation coefficient between relative abundances of biogeochemical functions (y axis) and DOM diversity features (x axis). Significant correlations (P < 0.05) are indicated by the black boxes. The first column of b shows the positive and negative Pearson’s correlation coefficients between biogeochemical functions and the first canonical axis. c FOAM orthologs correlated with DOM distributions, regarding methanogenesis in KEGG module M00567 and M00357. The protein catalog for quantification was restricted to methanogens (Additional file 9: Table S7) using Kaiju [70]. Moreover, it was further restricted to Methanothrix and Methanosarcina for aceticlastic methanogenesis. The red, blue, and yellow colors indicate significantly (P < 0.05) positive, negative, and nonsignificant (P > 0.05) Pearson’s correlation coefficients between FOAM orthologs and the DOM variance along the first canonical axis, respectively. Gray color indicates orthologs detected in less than eight samples, whereas white indicates orthologs undetected

