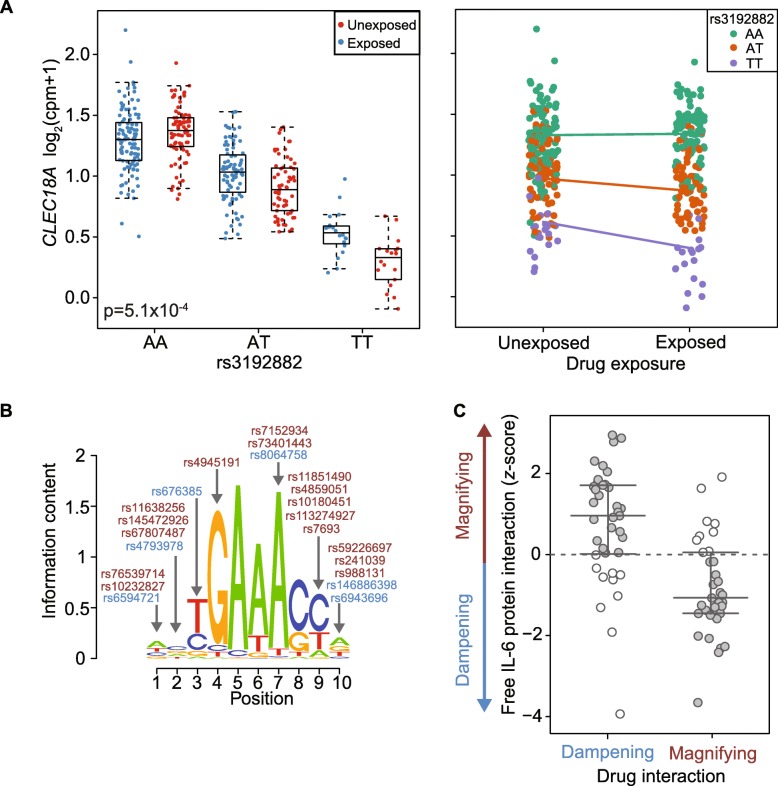
Fig. 3.
eQTL interactions with drug exposure. a Drug exposure interaction with the CLEC18A eQTL plotted with respect to rs3192882 genotype (left) and drug exposure (right). b The IRF4 motif enriched among eQTLs magnified following drug treatment. Arrows indicate positions of the motif interrupted by interaction SNPs (or SNPs in strong LD). Red and blue indicate SNPs corresponding to magnified and dampened eQTLs respectively. c Concordance of free IL-6 protein interaction effects with drug exposure interaction effects (gray indicates consistent direction)

