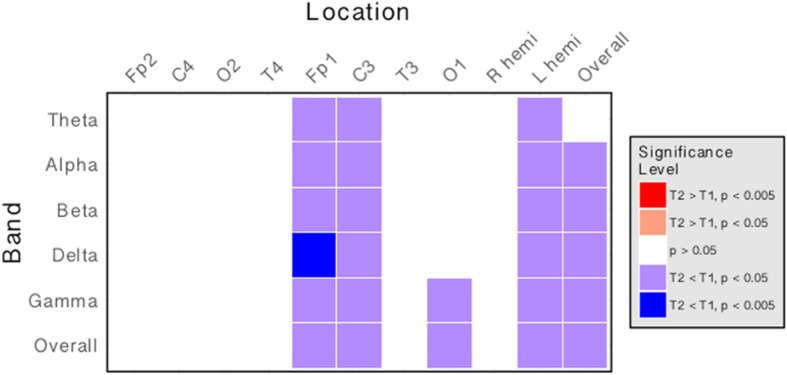
Fig. 5.

Spectral power is reduced across multiple bands at 10–14 months follow-up. Matrix illustrating the direction and magnitude of differences in spectral power at each frequency band and at each electrode location between timepoint 1 (0 months) and timepoint 2 (10–14 months). Each column represents a specific electrode location. Each row represents a frequency band. The colour of each cell indicates the direction of change (red: increase over time; blue: decrease over time). The intensity of the cell indicates the statistical threshold crossed (Wilcoxon signed rank test). There is a decrease in overall spectral power on follow-up, particularly in left frontal and parietal areas, indicating that spectral power profile changes with age
