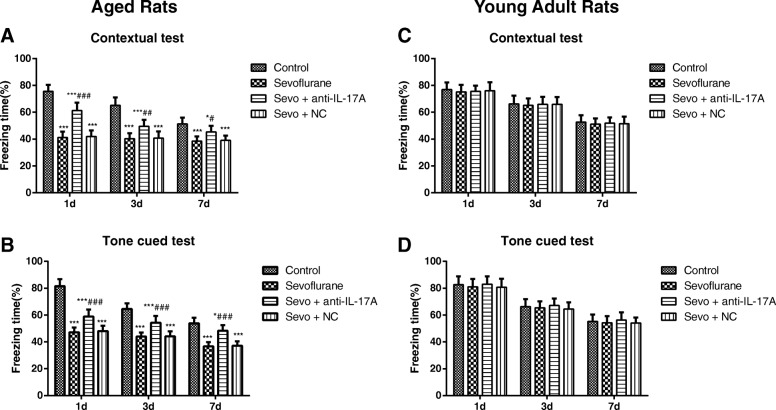
Fig. 2.
The percentage of freezing time at different time points after anesthesia in each group. Note: a, b The percentage of freezing time at different time points of contextual test and tone cued test of aged (a, b) and young adult (c, d) rats in each group. Compared with the Control group, *, P < 0.05,**, P < 0.01, ***, P < 0.001; compared with the Sevoflurane group #, P < 0.05, ##, P < 0.01, ###, P < 0.001

