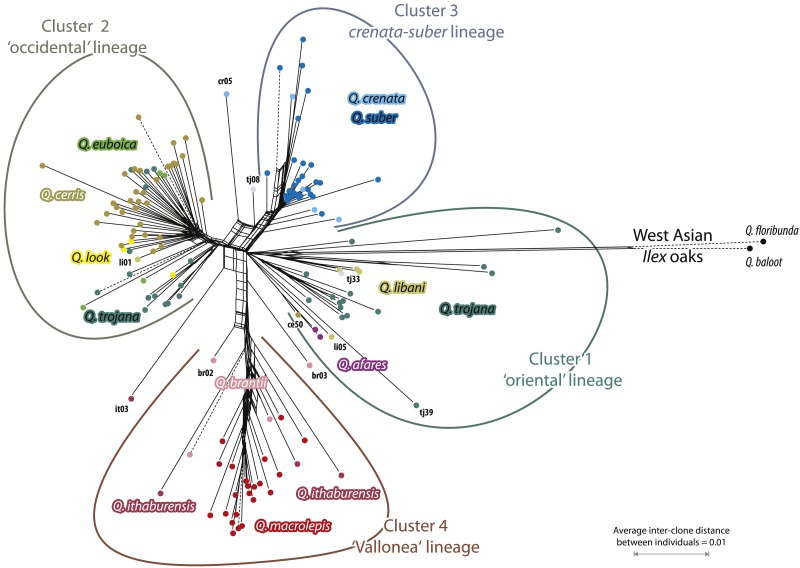
Figure 4. Network based on transformed 5S-IGS data showing inter-individual average (AVG) clonal distance relationships.
Only individuals represented by more than four clones are included (reconstructions for other cut-offs, m = 2, 3, or 5, are included in the File S5; see also our Online Supplementary Archive).

