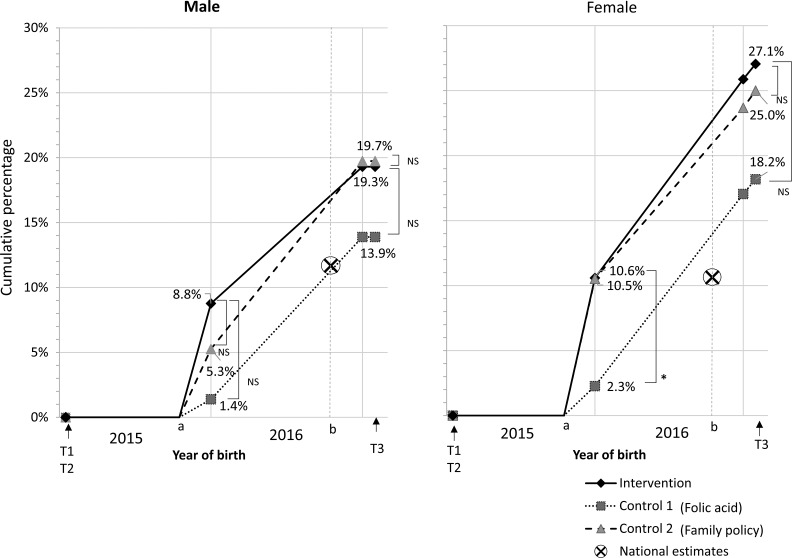
Figure 3.
Cumulative childbirths among participants who had been married or had a partner at T1. Significance of Fisher’s exact tests between groups was indicated by *(P < 0.05) and NS (not significant). aDepicted on the assumption that births were given later than 9 months after T1 (start point a). b12 months after start point a. × represents the national estimates, calculated from the national birth rates among those who have a spouse or a partner in their thirties: 0.12 and 0.11 per year among men and women, respectively. T1, before exposure to an information brochure; T2, immediately after exposure; T3, 2 years after exposure.

