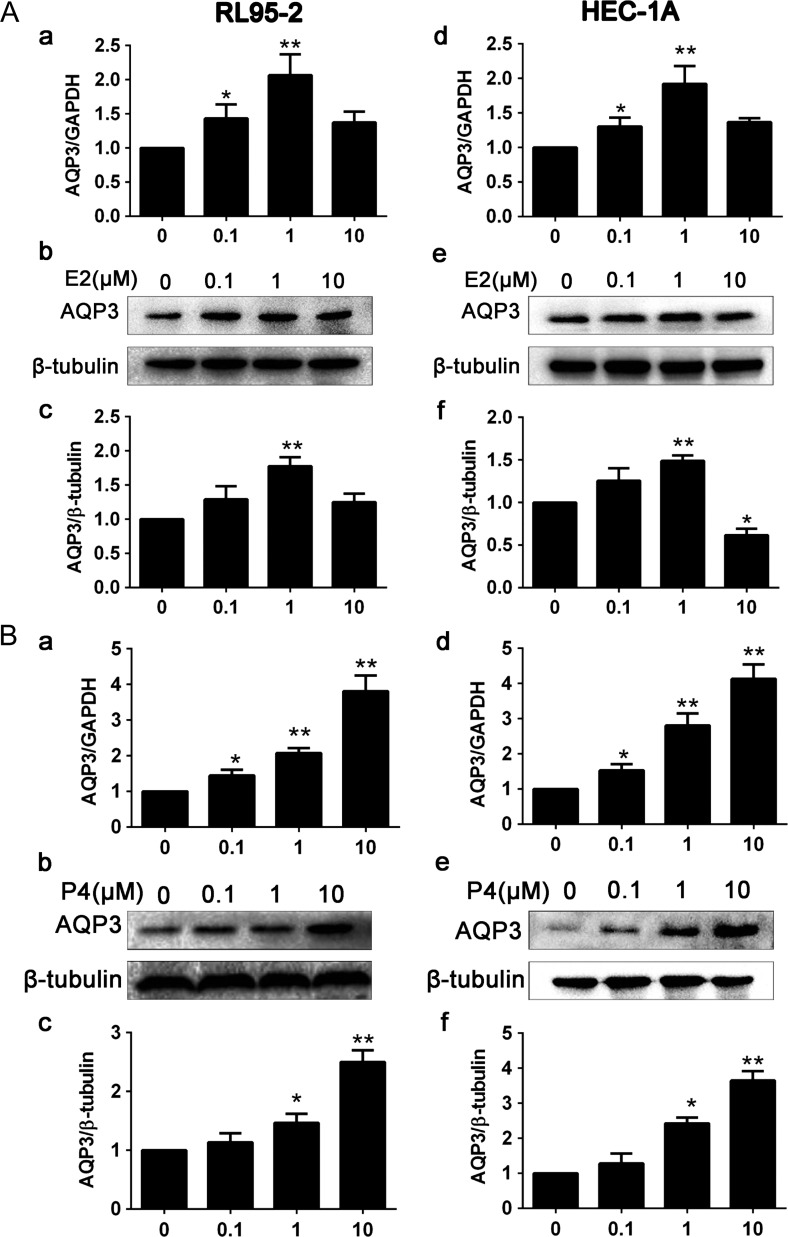
Figure 2.
Effects of progesterone and estrogen on AQP3 expression in RL95-2 and HEC-1A cells. Cells were treated with different concentrations of estrogen. (A) Real-time PCR analysis of AQP3 expression in RL95-2 cells (a) and in HEC-1A cells (d). Western blot detection of AQP3 expression in RL95-2 cells (b, c) and in HEC-1A cells (e, f). (B) Cells were treated with different concentrations of progesterone. AQP3 expression analysis by real-time PCR in RL95-2 cells (a) and in HEC-1A cells (d). Western blot analysis of AQP3 expression in RL95-2 cells (b, c) and HEC-1A cells (e, f). Experiments were repeated four times The data are presented as the means ± SD, *P < 0.05 and **P < 0.01 (Student’s t-test). The concentrations of progesterone and estrogen used were 0.1, 1 and 10 μM under serum-free conditions.

