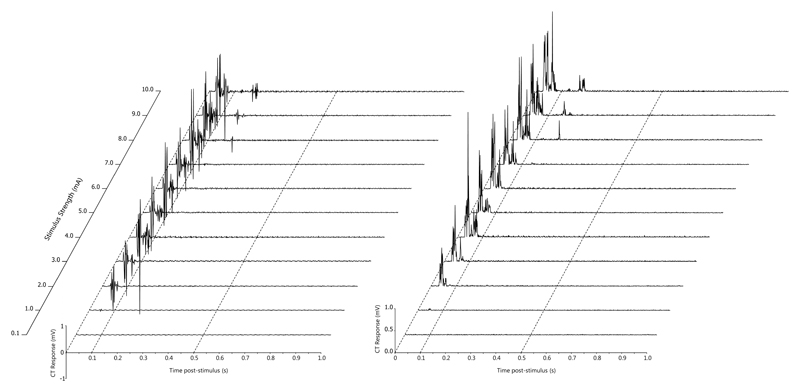
Figure 4.
An example of the electrical stimulus response curve recorded from the cranial tibial muscle in dog 98. The top channel is the stimulus marker channel, with each single line representing five 1 ms stimuli delivered at a frequency of 100 Hz. Eleven stimuli were delivered with a 60 second interval between them starting at 0.1 mA (baseline), 1 mA and increasing in 1 mA increments through to 10 mA. The middle channel shows the early responses in the cranial tibial muscle and the lower channel shows the rectified EMG response in the cranial tibial muscle. The time base is 0.2s/division

