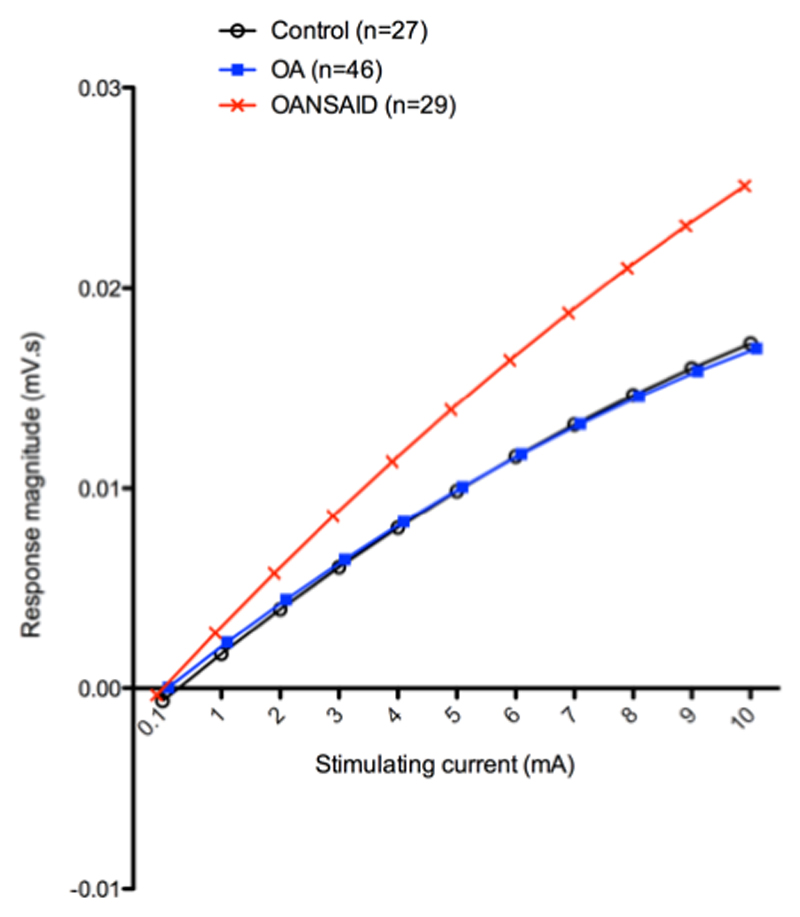
Figure 5.
Illustration of the mean curves predicted by the general linear model for stimulus response of dogs within differing OA categories, assuming a weight of 25kg. Each data point for the control animals is based on 27 dogs, for the OA group it is based on 46 dogs and for the OANSAID group it is based on 29 dogs. For each animal the mean response to the two repetitions of the stimulus response curve was averaged prior to analysis. The Y axis represents the natural logarithm of the magnitude of the EMG response and the X axis shows the magnitude of the stimulating current.

