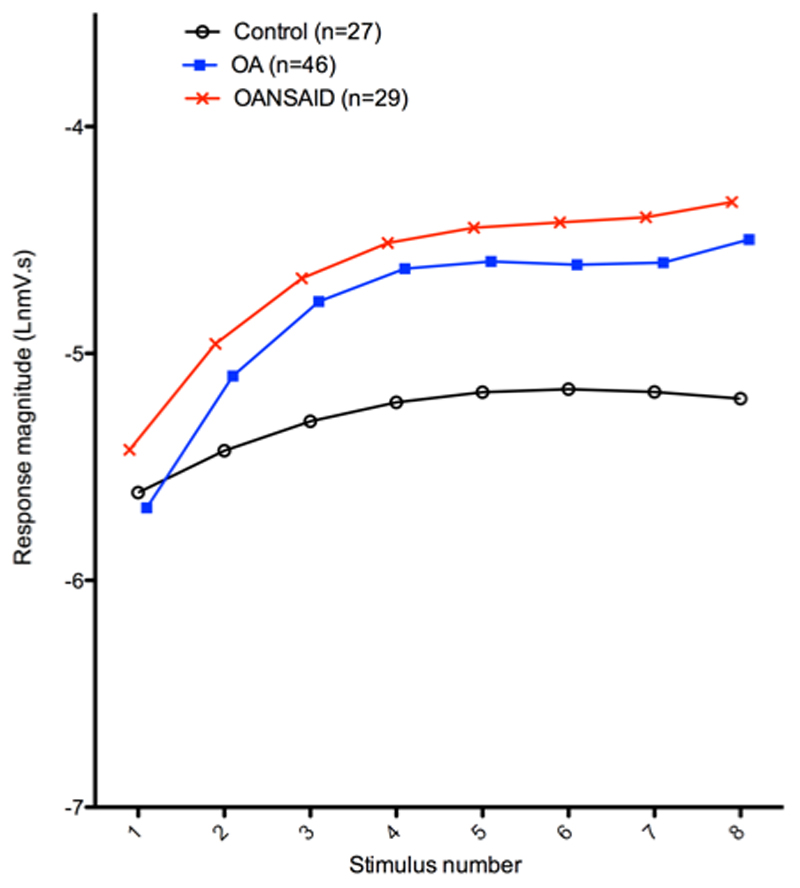
Figure 6.
Illustration of the mean curves predicted by the general linear model for the first occasion temporal summation late response for dogs within differing OA categories, assuming a weight of 25kg and age of 9 years. The Y axis represents the natural logarithm of the magnitude of the EMG response and the X axis shows stimulus number.

