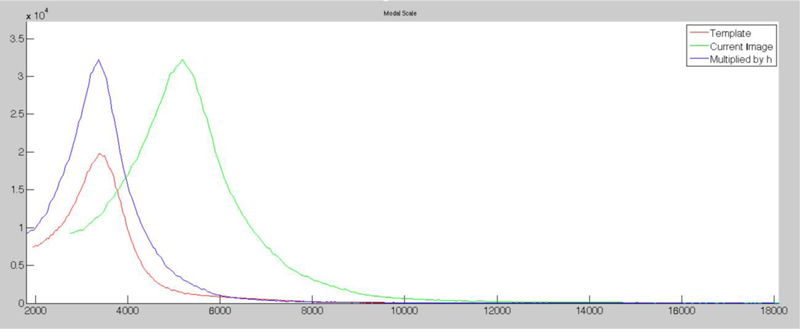
Figure 8. Histogram before and after modal scaling.

Graph showing the histograms of images before and after modal scaling using a template (red) to adjust the intensity scale of a current image (green) giving a final adjusted histogram for the current image matching the intensity distribution of the template (blue). Note that these are unsigned images (all intensity values are positive), and that the peaks of the histograms for the template (blue) and modal-scaled (red) images are similar, whereas prior to modal scaling the peak of the intensity histogram for the new image (green) was not coincident with the template histogram. (The graph is generated in MATLAB after running our modal scaling (see Supplemental data for code).
