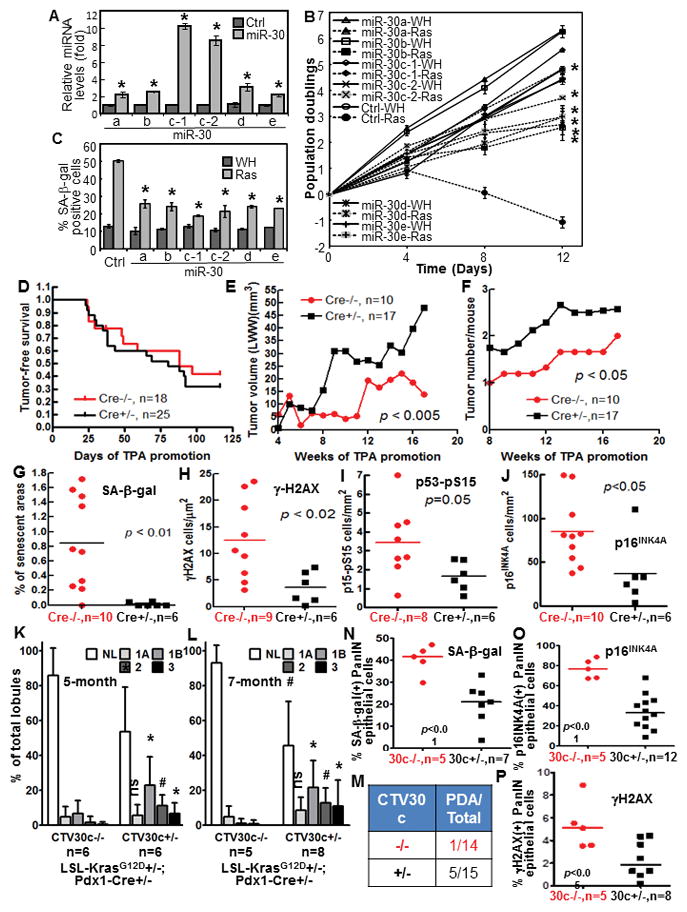
Fig. 1.

miR-30 disrupts ras-induced senescence, and miR-30c-1 promotes cancer development and disrupts senescence, DDR and p53 and p16INK4A induction in mouse models.
(A) miR-30 levels in BJ cells transduced with miR-30 family members (miR-30) or vector (Ctrl) measured by qRT-PCR.
(B) Growth curves of cells transduced with miR-30 members or vector (Ctrl) and ras (Ras) or vector (WH).
(C) % of SA-β-gal-positive cells on day-10 in cells in (B).
(A–C) Values are mean±SD for triplicates. * p < 0.05 vs Ctrl (A) or Ctrl-Ras (B, C) by Student t test.
(D) Tumor-free survival in miR-30-1 transgenic (Cre+/−) and non-transgenic (Cre−/−) littermates in 2-stage DMBA carcinogenesis.
(E–F) Average tumor growth rate (E) and number of tumors/mice (F) in miR-30-1 transgenic (Cre+/−) and non-transgenic (Cre−/−) littermates in 2-stage carcinogenesis.
(G–J) Quantification of cells positive for SA-β-gal (G), γ-H2AX (H), p53-pS15 (I) and p16INK4A (J) in DMBA-induced papilloma from miR-30-1 transgenic (Cre+/−) and non-transgenic (Cre−/−) littermates, normalized to tumor areas. p values determined by unpaired t test.
(K–L) % of pancreatic lobules containing normal (NL) and neoplastic ducts by grade (1A, 1B, 2 and 3) in 5-month (K) or 7-month (L) miR-30c-1 transgenic (CTV30c+/−) or control (CTV30c−/−) littermates. Values are mean±SD. *, p < 0.05; #, p < 0.01; ns, not significant for CTV30c+/− vs CTV30c−/− in unpaired t test.
(M) Number of miR-30c-1 transgenic (CTV30c+/−) and control (CTV30c−/−) littermates that developed PDA by month-7.
(N–P) % of SA-β-gal- (N), 16INK4A- (O) and γH2AX- (P) positive epithelial cells in PanIN lesions in miR-30c-1 transgenic (30c+/−) or control (30c−/−) pancreata. p values determined by unpaired t test.
