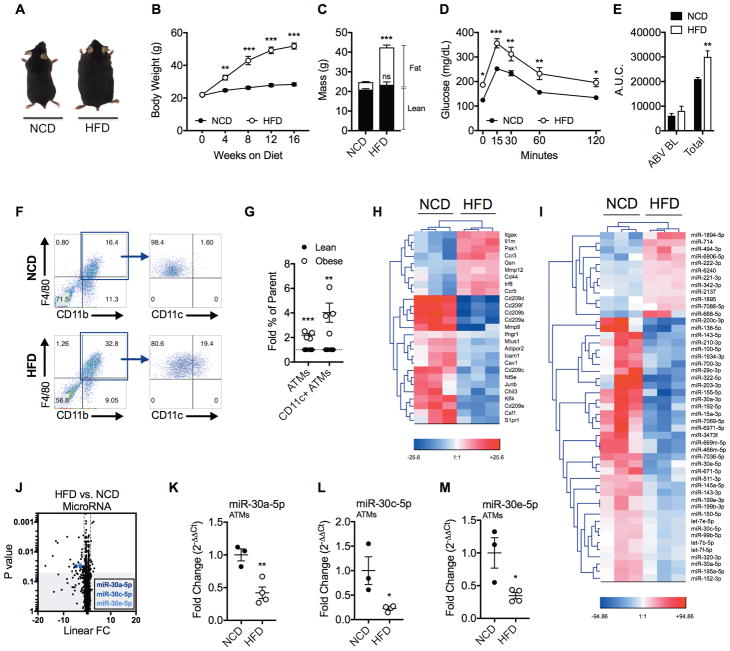
Fig. 1. HFD-Induced Obesity Stimulates ATM Inflammation and miRNA Dysregulation.
To study HFD-induced obesity, male C57BL/6J mice were fed NCD or HFD for 16 weeks until 22-weeks-old. (A) Representative photo of mice after 16 weeks of NCD or HFD feeding. (B) Weekly measurements of body weight growth. (C) DEXA body composition after 16 weeks of diet. (D) Oral glucose tolerance test (GTT) after 16 weeks of diet. (E) Area under the curve (A.U.C.) for GTT. Represented are A.U.C. above baseline (ABV BL) or total A.U.C. (F) Flow cytometry dot plots of F4/80+/CD11b+/CD11c+ ATMs in the epididymal fat stromal vascular fraction (SVF) of NCD- or HFD-fed mice. (G) Fold percentage increase quantification of F4/80+/CD11b+ cells in the SVF (denoted as “ATMs”) and CD11c+ ATMs. Lean mice were fed either NCD or 10% low-fat diet (LFD). Obese mice were fed 60% HFD. (H–J) Pooled F4/80+ ATMs from epididymal fat were used for transcriptome and miRNA microarrays. (H) Transcriptome microarray heatmap of differentially expressed mRNAs in ATMs related to macrophage polarization. (I) MicroRNA heatmap of differentially expressed miRNAs in ATMs. (J) MicroRNA array volcano plot depicting linear fold change (FC) vs. ANOVA p-value significance. (K–M) qRT-PCR expression validation of miRs 30a-5p, 30c-5p, and 30e-5p. For (A–F), the values are shown as mean ± SEM and are from a single experiment representative of at least 3 independent experiments with 5 mice per experimental group. For (G) data shown as mean ± SEM of 4 independent experiments with 5 mice per experimental group. For (H–M), the data shown are mean ± SEM and are from 3–4 independent experiments with 20 pooled NCD mice and 10 pooled HFD mice per experiment. Statistical differences were determined by using Student’s t-test. *p<0.05, **p<0.01, ***p<0.001. See also Figure S1 and Table S1.

