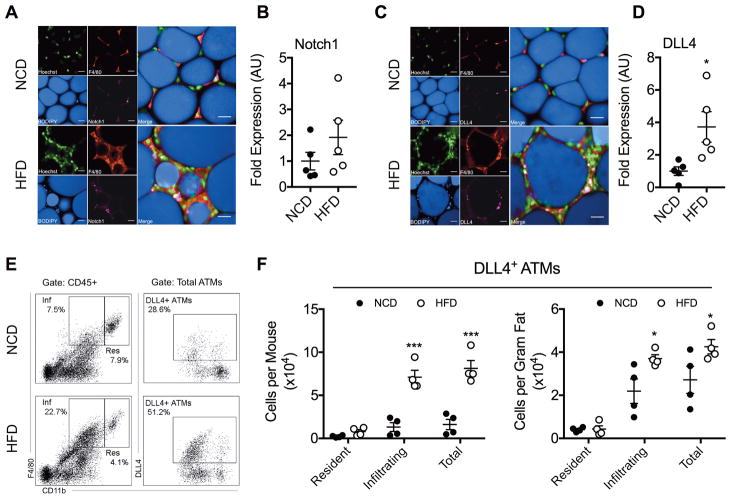
Fig. 2. DLL4 Expression is Elevated in Obese ATMs.
HFD-induced obesity was studied as described in Fig 1 legend. At 22-weeks-old, visceral adipose tissue and adipose SVF were analyzed for DLL4 expression. (A&C) Immunofluorescent staining of whole-mount epididymal fat. Scale bar = 20 μm. Presented are representative confocal micrographs of Notch1 (A) or DLL4 (C). (B&D) Image quantification of Notch1 (B) or DLL4 (D) in adipose tissue. The values are shown as mean ± SEM and are from a single experiment representative of 2 independent experiments with 5 mice per experimental group. (E) Flow cytometry dot plots of DLL4+ ATMs in epididymal fat. CD11bint are denoted as infiltrating (“Inf”) and CD11bhi are denoted as resident (“Res”). (F) Quantification of DLL4+ ATM cell counts represented per mouse and per gram fat. Values are presented as mean ± SEM and are from a single experiment representative of 2 independent experiments with 4 biological replicates (pools of 1–6 mice) per experimental group. Statistical significance was determined by Student’s t-test. *p<0.05, ***p<0.001. See also Figure S2.

